Environmental Engineering Reference
In-Depth Information
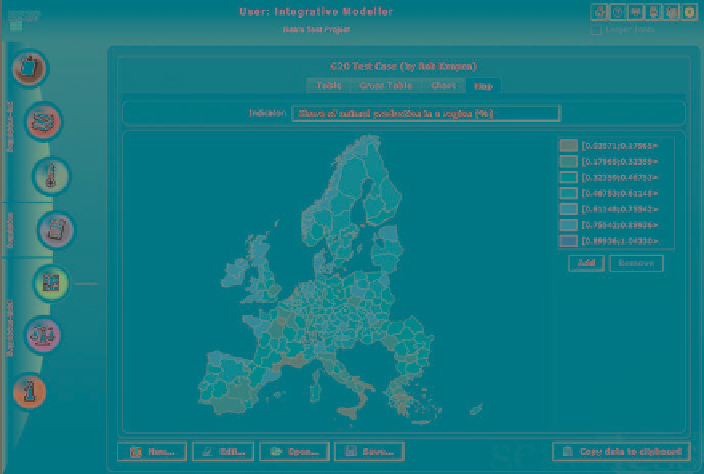
Fig. 9.13
SeamPRES map viewer displaying indicator results per NUTS2 regions
SeamGUI SeamPRES uses all information and functionality from the other
components to perform its specific tasks. For example the selection of indicators is
used in SeamPRES to decide what values are supposed to be visualized and
possible compared to each other, avoiding some of the possible illogical choices
that a user could make. SeamPRES uses the same functionality as the rest of
SeamGUI to communicate with the SeamServer to retrieve the calculation results.
Some specific optimisations have been made to cope with the large amount of data
and variety of types of indicators that have to be processed (see also Fig.
9.13
).
Conclusions
The challenge in integrated modelling is the conceptual integration. To achieve this,
we need explicit semantics and a shared conceptualization. A participatory and col-
laborative approach is a key success factor for the creation of a common ontology
for models, indicators and raw data. SEAMLESS has achieved a very important
shift in integrated modelling practice, i.e. modellers specify the data requirements
of their models in a higher level, i.e. that of an ontology. This ontology is then
automatically transformed into a relational database model, to which “data collecting”
activities need to comply with. This ensures the match between data collection and
data requirement for running the model-chain. It also provides the required semantic