Environmental Engineering Reference
In-Depth Information
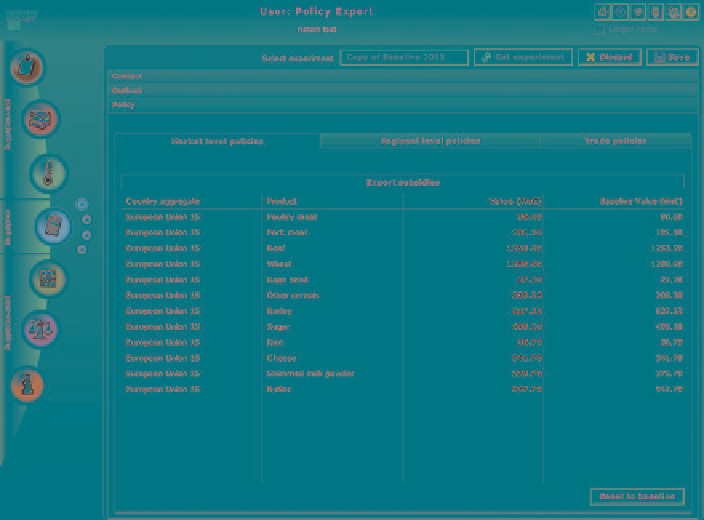
Fig. 9.12
Detailed experiment configuration in the SeamGUI. The example gives the export subsi-
dies for different commodities in a policy proposal
At present, only one model chain can be executed at a time, but the current
design also allows for parallel execution of more model chains at once, by installing
multiple (virtual) servers with all required models and a Processing Environment.
The Visualization Environment (Post-modelling Phase)
SeamPRES is the visualization tool in SEAMLESS-IF, implemented as a component
of the SeamGUI application. It enables the users of SEAMLESS-IF to interactively
display impacts, indicators and model outputs and provides clipboard copy and
paste integration with other applications. For example it is possibly to copy table
data from SeamPRES to the systems clipboard and paste it into another application
like Microsoft Excel for further processing. SeamPRES is a tool that can digest and
visually display SEAMLESS model outputs in various ways, to improve the analysis
and the dissemination of the model results. These model outputs are either available
directly, processed (or copied) into indicator results or, when compared based on
experiments and expected changes, as impacts.
The initial version of SeamPRES can retrieve calculated indicator values and display
those in three major ways: tables, graphs and maps. As an integrated component of