Environmental Engineering Reference
In-Depth Information
visualisation (
http://www.microsoft.com/virtualearth/default.aspx
)
or Skyline
Globe
http://www.skylineglobe.com
.
Google Earth offers facilities with Google
Earth Outreach (
http://earth.google.com/intl/en_uk/outreach/index.html
)
and
SketchUp (Google Inc
2006)
. A “Google Earth Community” (
http://bbs.keyhole.
com/ubb/categories.php/Cat/0
)
and several international societies have appeared
(for example the International Society For Digital Earth
http://www.digitalearth-isde.
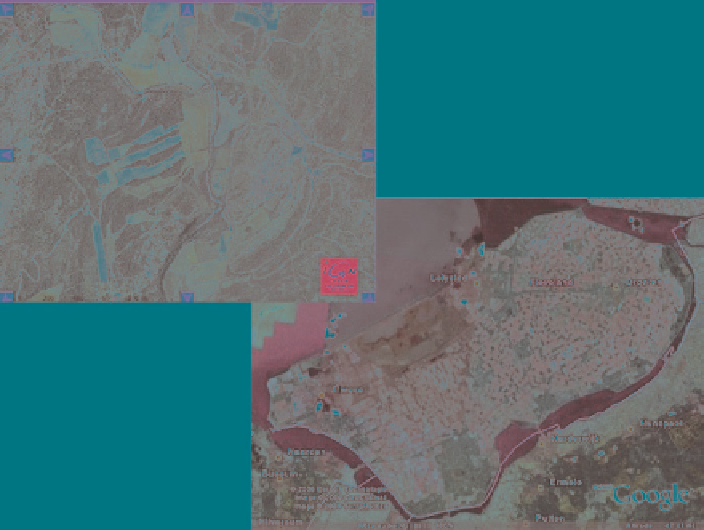
the French Geoportail and with Google Earth for two different situations, and
Fig. 6.
2
shows details for Flevoland in 2D and in 3D. Figure
6.3
shows an example
of 3D view of a coastal village, with 3D extruded buildings (Géoportail).
The examples show
static
views based on aerial (satellite) photographs, at a
specific date, but they are not dynamic. The challenge in SEAMLESS was to enable
visualising
future changes
in land use, according to scenarios. It is also expected to
produce more details than can be seen in Figs.
6.1
-
6.3
.
In the last 20 years, research on 3D landscape modelling has increased consider-
ably, mainly for urban planning, but also for rural and forest landscapes (Danahy
1989
; Auclair et al.
2001
a;
b
; Bishop et al.
2001
; Lovett et al.
2001
; Orland et al.
2001
; Herwig and Paar
2002
; Snyder
2003
; Dockerty et al.
2005
; Paar and Clasen
2007
; Lange et al.
2008)
. Several international meetings have addressed the issue
Fig. 6.1
(
a
) Example of a landscape viewed from above: the Restinclières agroforestry estate
(France) viewed with the French Geoportail. (
b
) Example of a landscape viewed from above: the
Flevoland area (The Netherlands) viewed with Google Earth