Environmental Engineering Reference
In-Depth Information
2.4.1 Electrochemical Behavior of Active-Passive Metals
If a metal exhibiting passivity, e.g., iron in 1 N H
2
SO
4
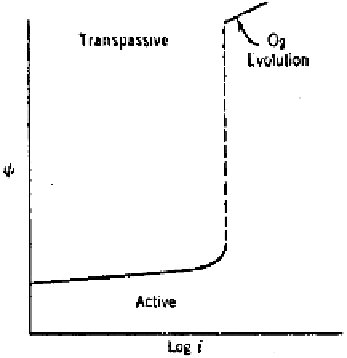
, is anodically polarized
by the glavanostatic method (i.e., in which the current is maintained constant and
the potential is allowed to change), the polarization curve so obtained has the
shape as shown in Fig. 2.19.
The initial portion of the curve shows an increase in potential in the positive
direction with increasing applied current density in conformity with the typical
Tafel behavior. Beyond a certain value of current density the potential jumps
abruptly to a higher value accompanied by oxygen evolution. At this high poten-
tial range, the anodic discharge of oxygen takes place according to reverse of
the reaction (2.7), i.e.,
2H
2
O
→
O
2
4H
4e
(Reverse of Eq. 2.7)
However, if the metal is polarized potentiostastically (i.e., whereby the incre-
ment in potential is given by potentiostat and the current is allowed to adjust
itself), the polarization curve takes the shape as shown in Fig. 2.20.
The dissolution shows Tafel behavior initially, the current density increasing
with increasing applied potential. This is the active region. At
E
pp
, which is called
the primary passive potential, the current density shows a maximum value,
i
cr
,
the critical current density for passivity. Polarization beyond
E
pp
lowers the disso-
lution drastically, as characterized by the low value of current density, which
remains essentially independent of potential over a considerable potential range.
This is termed the
passive region
. At still higher potentials, the current density
Figure 2.19
Galvanostatic anodic polarization curve for an active-passive metal.