Environmental Engineering Reference
In-Depth Information
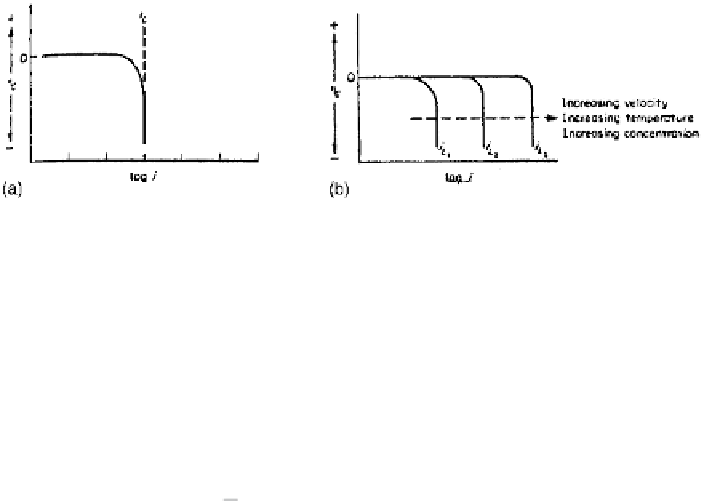
Figure 2.13
(a) Concentration polarization curve for reduction process and (b) effect
of environmental variations on concentration polarization curve.
tration of the reacting species (H
ions) changes from
C
in the bulk to zero
at the electrode surface
A mathematical expression for concentration polarization involves
i
L
and is
given by
2.3
RT
F
i
i
L
η
c
log
1
(2.41)
where
η
c
is overvoltage due to concentration polarization, in volts. A graphical
representation of the equation is shown in Fig. 2.13.
It can be seen from the graph as well as from Eq. 2.41 that as
i
approaches
i
L
,
η
c
tends to infinity. As evident from Eq. 2.40, factors like increasing velocity
(smaller
x
), increasing temperature (higher
D
), and increasing concentrations in-
crease the value of
i
L
, i.e., a shift of the vertical portion of the curve in Fig. 2.13
more to the right.
There is no question of concentration polarization where the supply of reacting
species is abundant. Hence in metal dissolution reaction its effect is negligible,
as the supply of metal atoms for dissolution is unlimited. On the other hand, for
a hydrogen evolution reaction, concentration polarization becomes significant in
the solutions of low H
ion concentration. More often the reduction process is
controlled by a combined polarization, i.e., activation polarization at lower reac-
tion rates and concentration polarization at higher reaction rates, as
i
approaches
i
L
. A graphical representation of such combined polarization is shown in Fig.
2.14.
2.3.3 Mixed Potential Theory
In the case of zinc corroding in hydrochloric acid, as has been discussed in Sec-
tion 2.1.1, the constituent anodic and cathodic reactions are: