Environmental Engineering Reference
In-Depth Information
the potential and pH (acidity or alkalinity) of the aqueous solution. The potential
is shown on the vertical axis and the pH on the horizontal axis. Such diagrams
are constructed from calculations based on the Nernst equation and the solubility
data for various metal compounds. The potential-pH diagram for an Fe-H
2
O sys-
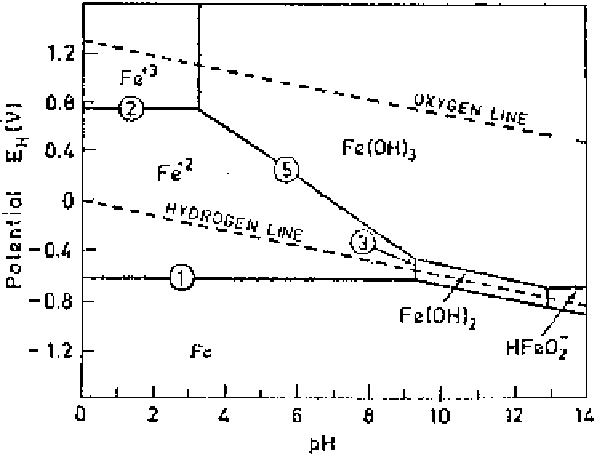
tem is shown in Fig. 2.9. In the diagram, the horizontal lines represent pure
electron transfer reactions, dependent solely on potential, but independent of pH:
(1) Fe
Fe
2
2e
(2.24)
(2) Fe
2
Fe
3
e
(2.25)
These lines extend across the diagram until the pH is sufficiently high to facili-
tate the formation of hydroxides, represented by vertical lines, thereby reducing
the concentration of Fe
2
and Fe
3
ions. The boundary is often set arbitrarily at the
concentration of these ions at 10
6
g-ion/liter, which is indicative of a negligible
dissolution or corrosion of the metal in the medium.
The vertical lines correspond to the reactions:
(3) Fe
2
2H
2
O
Fe(OH)
2
2H
(2.26)
(4) Fe
3
3H
2
O
Fe(OH)
3
3H
(2.27)
Figure 2.9
Potential-pH (Pourbaix) diagram for Fe-H
2
O system.