Agriculture Reference
In-Depth Information
200
Population (%)
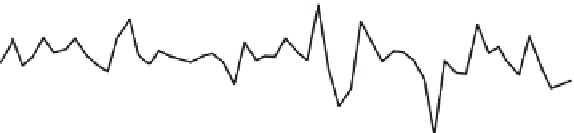
Growing gap between agricultural
capacity and population
Potential link between radiative
forcing and declining rainfall
during main growing seasons
Cropped area (%)
150
Seeds (%)
Fertilizer (%)
100
0
Global radiative
forcing (Wm
-2
)
3
Main growing season rainfall (%)
50
1951
1960
1970
1980
1990
2000
copyright National Academy of Sciences, USA, used with permission).
Note
The plot shows trends in rainfall, population, cropped area, seed use and fertilizer use for eastern and south-
ern Africa. Rainfall is expressed as a percentage of the 1951-80 average. The other variables are expressed as
percentages of 1979-81 averages. Global radiative forcing, representing climate change, is shown with a
dashed line on an inverted axis.
Model's capability to estimate current food insecurity and projections
Despite its crude formulation, the food balance model expressed above can capture observed
FAO observations of the numbers of undernourished people in the Sahel, Southern Africa and
Eastern Africa (
Figure 4.7
). The figure shows that the model is able to estimate the actual number
of people in a condition of undernourishment provided by the FAO. The FAO calculates this
statistic by estimating the amount of food produced and dividing it with the total population,
resulting in the amount of food available for all people. Undernourishment refers to the condition
of people whose dietary energy consumption is continuously below a minimum dietary energy
requirement for maintaining a healthy life and carrying out a light physical activity.
Although these results look very good, it is important to keep in mind that the FAO cal-
culates its number of undernourished in a similar way to the calculations in the Food Balance
Index model. The differences in the inputs and calculations are very small, and thus we are
able to reproduce the FAO data quite easily. The FAO is not able to go to each region and,
in a statistically rigorous way, measure the actual number of malnourished individuals, thereby
deriving the numbers of food insecure independently from broader statistics on food available
and population. There are comprehensive nutrition datasets like the Demographic and Health
Data that directly measure malnutrition using statistical sampling, but these surveys are con-
ducted only every five years, are not available in all countries and are not used in the FAO
statistics. For the purposes of this analysis, however, we are able to capture the interannual
variability of the FAO analysis of undernutrition using our model.
Given that the model is able to capture previous variability in the numbers of food inse-
cure, then if we use the model to project into the future, we are able to see how changes in
structural food insecurity due to population expansion, changes in rainfall and changes in


Search WWH ::

Custom Search