Agriculture Reference
In-Depth Information
2011
2012
STM
120
110
100
90
80
70
60
50
40
30
20
10
Jan.
Feb.
Mar.
Apr.
May
Jun.
Jul.
Aug.
Sep.
Oct.
Nov.
Dec.
Dekads
2011
2012
STM
1,100
1,000
900
800
700
600
500
400
300
200
100
Jan.
Feb.
Mar.
Apr.
May
Jun.
Jul.
Aug.
Sep.
Oct.
Nov.
Dec.
Dekads
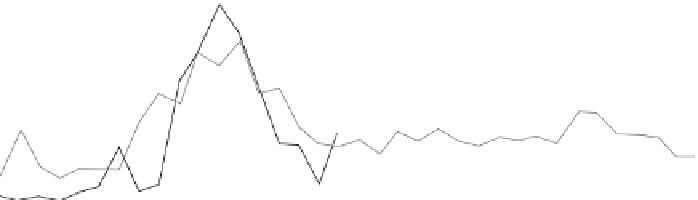
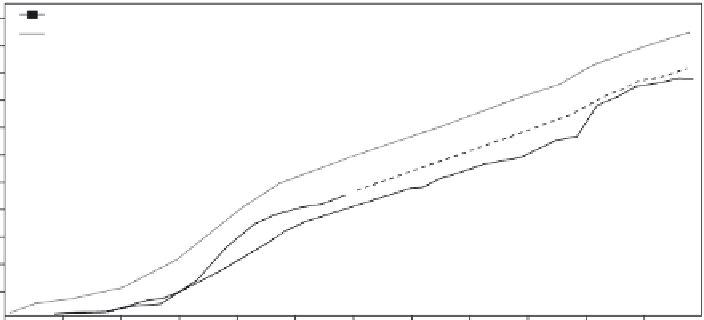
FIGURE 3.2
The ten-day (dekadal) rainfall from NOAA's Rainfall Estimate in 2011, 2012 and for
the short-term or five-year mean for Ethiopia's Southern Nations, Nationalities and
Peoples' state (source: USGS Early Warning System rainfall data imagery site, early-
warning.usgs.gov).
Note
The upper figure shows the time series and the lower figure the cumulative rainfall. The 2011 period had
lower rainfall than the 2012 period and both are below the short-term mean. The dashed line shows the
rainfall climatology prediction, which is the rainfall for the remainder of the year if current conditions
persist.
of how conditions have varied through time. Although the AVHRR sensor has a low spatial
resolution of 8,000 × 8,000 meter pixel size, the NDVI data have been used extensively since
1981 to study a variety of global land processes (Townshend, 1994; D'Souza
et al
., 1996;
Cracknell, 1997; van Leeuwen
et al
., 2006; Neigh
et al
., 2008; Pettorelli
et al
., 2011; Brown
et al
., 2012).
The abundance and greenness of vegetation across the land surface can be seen from space
and maps made of its change through time. This is because vegetation pigment absorption,


Search WWH ::

Custom Search