Environmental Engineering Reference
In-Depth Information
10.3.1 Spatial Distribution
Away from polluted areas, deposition from the bulk atmosphere is the main way by which
persistent compounds arrive to vegetation. Therefore, the concentrations of these pollut-
ants in plants are a reflection of their atmospheric concentrations in the area. This theory
has been confirmed by a group of studies that used vegetation as a passive sampler for
monitoring pollution in contaminated areas.
DDT has been analyzed in natural vegetation samples in a total of 34 countries. Most of
the studies have been carried out in the Northern Hemisphere; a total of 141 have been per-
formed in Europe, 37 in Africa, and 24 in Asia. The rest have been carried out in America
(principally in the South) and in Antarctica (Figure 10.1).
In most performed analysis of DDTs (considering the DDT, DDE, o,p'-DDT, p,p'-DDT, o,p'-
DDE, p,p'-DDE, o,p'-DDD, and p,p'-DDD congeners), positive results have been observed
(about 90% of the compiled studies), although in 48% of the studies, the mean concen-
tration is below 1 μg/kg (data in dry weight). However, in 25% of the analyses, average
concentrations between 1 and 5 μg/kg were found. Only, in 11% of the cases, the average
concentrations of DDT were above 20 μg/kg. The highest concentrations obtained were for
p,p'-DDT, whereas the lowest concentrations were for the isomer o,p'-DDE.
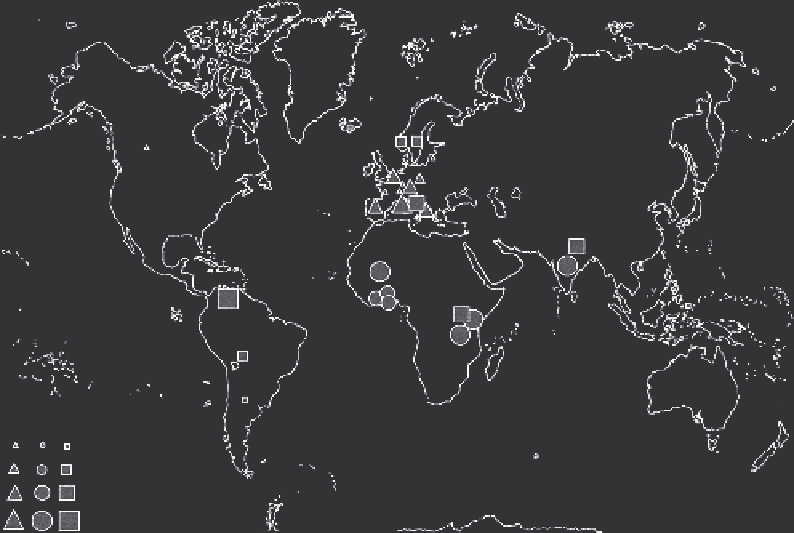
Figure 10.1 shows the average concentrations of DDTs found in different species of
Pinus
spp.,
Mangifera indica,
and lichens/mosses, which constitute most of the studied species (on
a global scale) around the world. The high concentrations obtained in Africa (Kenia, Ghana,
Mali), India, and the Amazonas are outstanding. The highest concentration, found in the
bibliography, occurs in Tanzania, in
M. indica
leaves: a concentration of 485 μg/kg (concretely
the p,p'-DDT; Mahugija-Marco and Kisimba 2007). In Europe, the high concentrations in
<
0.1-0.5
µ
g/kg
0.6-1.0
µ
g/kg
1.1-10.0
µ
g/kg
>
10.1
µ
g/kg
FIGURE 10.1
Distribution of DDTs (mean concentrations) in
Pinus
spp. (triangle),
Magnifera indica
(circle) and lichen/moss
(square) around the world. The size of the symbol indicates different mean concentration of DDT (see legend).
Search WWH ::

Custom Search