Database Reference
In-Depth Information
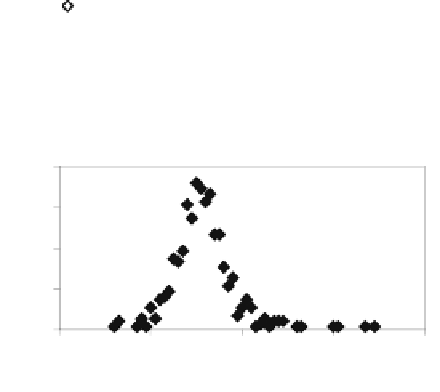
Histogram of Multimerge Access Time
80
60
40
20
0
0
0.05
0.1
0.15
0.2
0.25
Average Time (msec)
Histogram of Forward Index Access Time
60
45
30
15
0
0
2
4
6
8
Average Time (msec)
FIGURE 10.24
:Like
t
scan
,
t
forward
is concentrated and can be reasonably
replaced by a point estimate.
assumption that the selectors occur independently of the candidates, we see
k
=
k
corpusCount
(
g
)
corpusCount
(
a
)
(10.9)
as a natural and simple choice, using which we can write the query bloat
factor as
corpusCount
(
g
)
corpusCount
(
a
)
2
.
We call this
queryBloat
(
a, g
), the bloat because
a
had to be generalized to a
given
g
.Foragiven
R
,wecannowwrite
queryBloat
(
a, R
)=
1
,
corpusCount
(
g
)
corpusCount
(
a
)
+
k
t
forward
t
scan
if
a
∈
R
(10.10)
R,a
IsA
g
queryBloat
(
a, g
)
,
min
otherwise
g
∈
Note that at query execution time the choice of
g
from a given
R
is simple,
but choosing a good
R
ahead of time is non-trivial.
Figure 10.25
shows a study of estimated bloat compared to observed bloat.
The fit is not nearly as good as with the other half of our model in
Figure 10.22
,


Search WWH ::

Custom Search