Database Reference
In-Depth Information
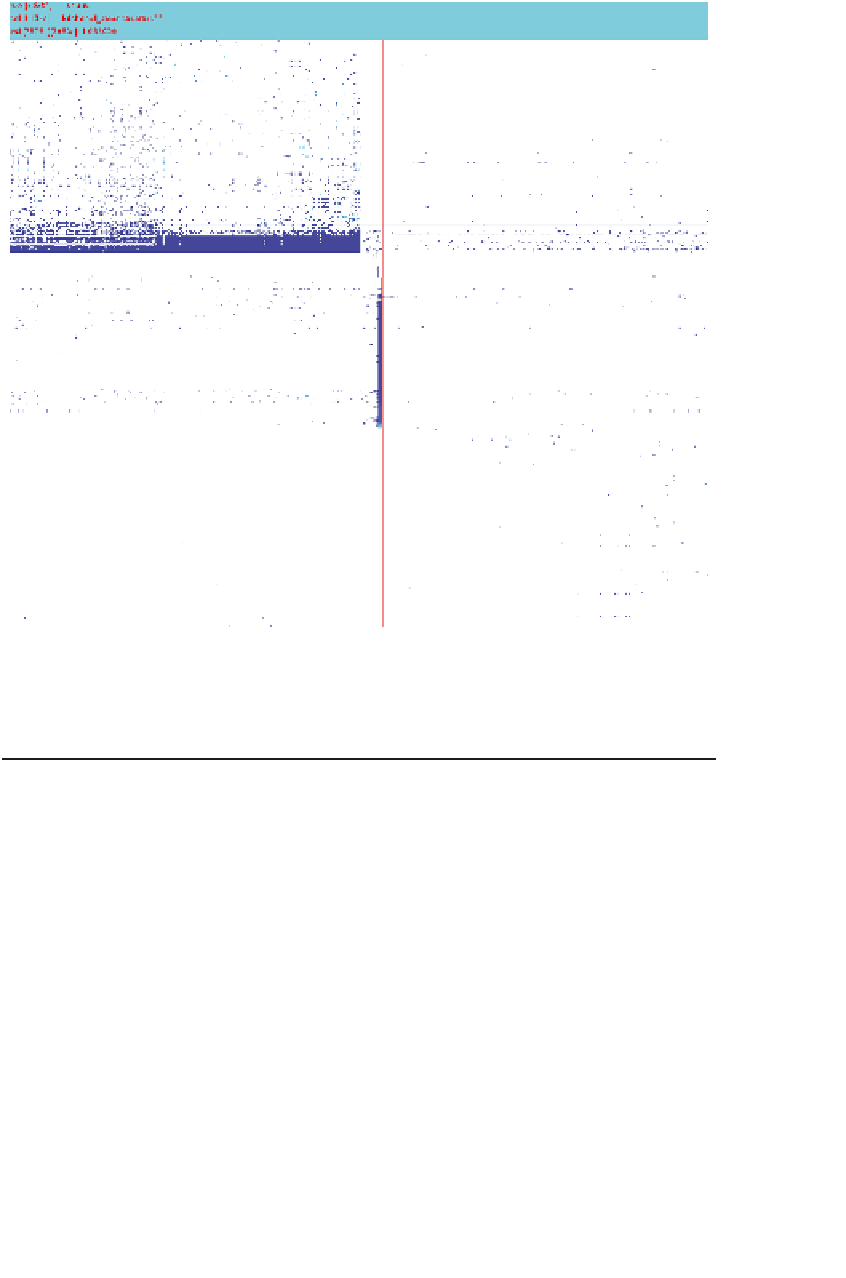
FIGURE 5.10
: Close-up of one section of pixel plot of the reordered Enron
term-by-document matrix.
Mixed
Cluster1
Cluster2
1
1
0.8
0.8
0.6
0.6
0.4
0.4
0.2
0.2
0
0
−0.2
−0.2
−0.4
−0.4
−0.6
−0.6
−0.8
−0.8
−1
−1
−1
−0.5
0
0.5
1
−1
−0.5
0
0.5
1
(a)
(b)
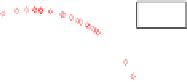
The small-mix dataset.
A clustering of small-mix.
FIGURE 6.4
: Small-mix dataset and its clustering by
soft-moVMF
.


Search WWH ::

Custom Search