Database Reference
In-Depth Information
FIGURE 5.8 (SEE
COLOR INSERT
FOLLOWING PAGE 130.)
:
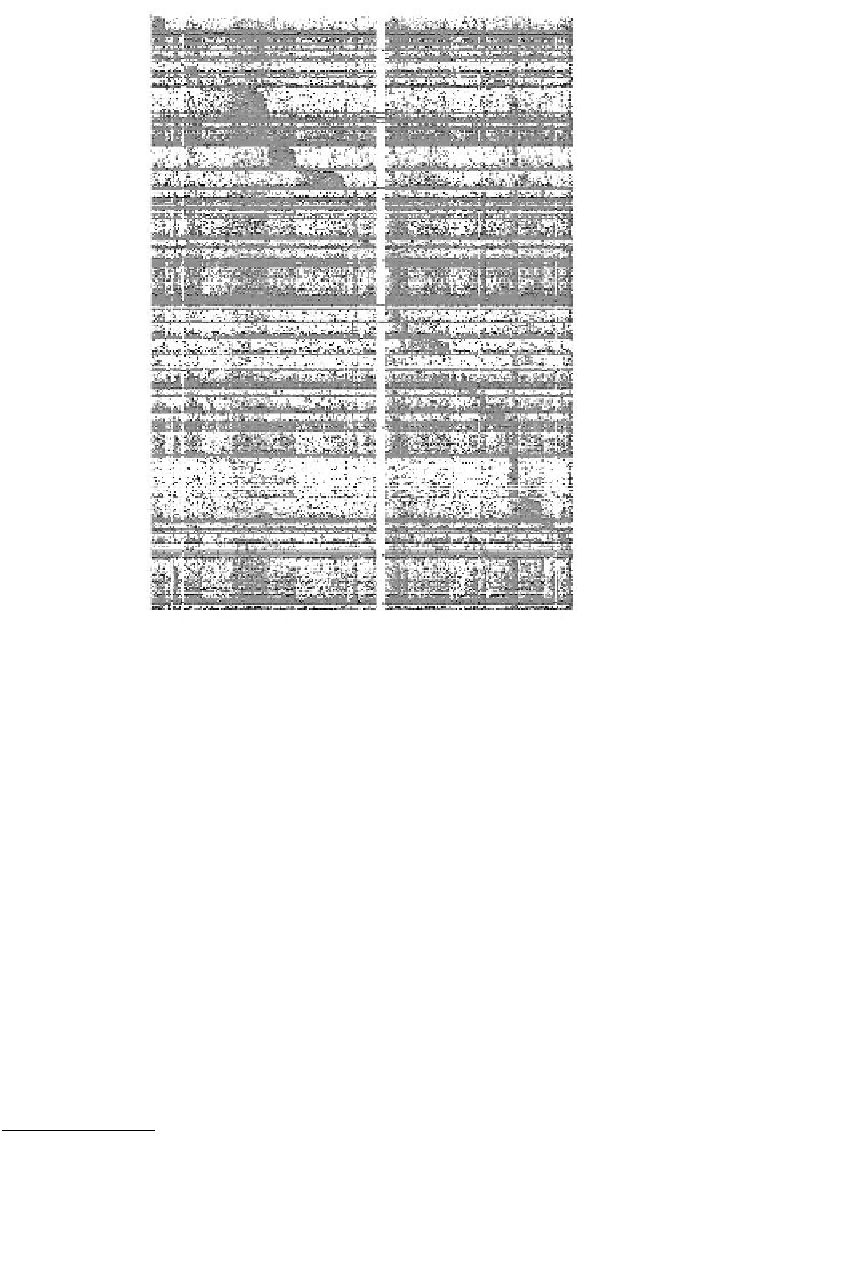
Pixel plot of the reordered Enron term-by-email matrix.
Figure 5.8 is simply a reordered version of the raw Enron term-by-email
matrix using
r
= 50 (the number of columns of
A
and rows of
B
). Both
the terms and the documents were reordered according to the hard cluster
assignments produced by the NMF. The nice block structure of the reordered
matrix reveals the hidden clusters. For instance, a dense block means that a
set of documents frequently used the same set of terms. Contrasting
Figure
5.7
with Figure 5.8 reveals just how much structure was hidden in the dataset.
While the visualization of Figure 5.8, which was created with the NMF, is
valuable to practitioners, an even more valuable tool allows the practitioner
to more deeply examine clusters of interest and perhaps attach a meaning to
the cluster. This is possible with the help of the vismatrix tool
5
created by
David Gleich.


Search WWH ::

Custom Search