Agriculture Reference
In-Depth Information
have shown that corn genotypes vary in their response to N availability, reflecting variations in
their relative abilities to absorb native or fertilizer N from the soil. Similar observations have been
reported by Moll et al. (1982) in the absorption and utilization of N by corn genotypes.
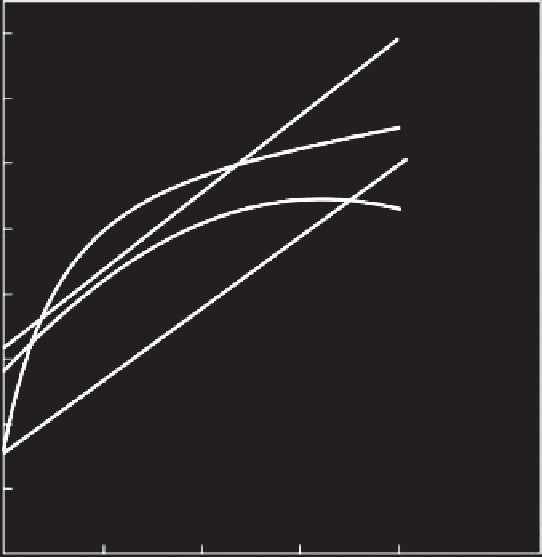
Figure 8.23 shows the responses of four lowland rice genotypes to N fertilization. These geno-
types differ in yield response to applied N and can be grouped into three classes according to their
responses to N fertilization. The first group was efficient and responsive to N. The genotype that
produced above-average yields compared to all the genotypes tested at the low N level responded
well to applied N—this was CNAi 9018. The second classification was efficient and nonresponsive.
The genotype that produced well at low N rates did not respond well at higher N rates—this was
CNAi 8569. The third group was genotypes that produced low at low N rates, but responded well
to higher N rates. These have been designated as inefficient and responsive—these were Bigua
and Jaburu. From a practical point of view, the genotypes that fell into the efficient and respon-
sive group would be the most desirable, because they can produce well at low soil N levels and
also respond well to applied N. Thus, this group could be utilized with low as well as high input
technology with reasonably good yields. The second most desirable group would be efficient non-
responsive. Genotypes of this type can be planted under a low N level and still produce more than
average yields. The inefficient responsive genotypes could be used in breeding programs for their
N-responsive characteristics. Similarly, Figure 8.24 shows the linear and quadratic responses of five
lowland rice genotypes grown on a Brazilian Inceptsol. Figure 8.25 shows the responses of upland
rice genotypes to N fertilization. All the genotypes were having similar responses but the magni-
tude of response was different.
8000
CNAi 9018
7000
BIGUA
′
JABURU
6000
CNAi 8569
5000
4000
3000
2000
R
2
= 0.8519**
CNAi (Y) = 3188.7680 + 23.6841X,
BIGUA
′
(Y) = 1615.4320 + 35.3887X - 0.0541X
2
,
R
2
= 0.9162**
R
2
= 0.8630**
R
2
= 0.7935**
1000
JABURU (Y) = 1568.0800 + 22.1013X,
CNAi 8569 (Y) = 2884.8080 + 30.9615X - 0.0993X
2
,
50
100
150
200
Nitrogen application rate (kg ha
-1
)
FIGURE 8.23
Response of lowland rice genotypes to N fertilization. (From Fageria, N. K., Stone, L. F.,
and Santos, A. B. 2003b.
Soil Fertility Management of Irrigated Rice
. Santo Antônio de Goiás, Brazil:
EMBRAPA—Rice and Bean Research Center. With permission.)