Agriculture Reference
In-Depth Information
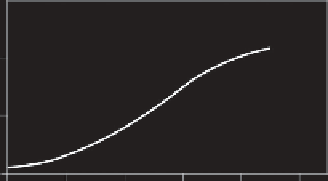
Y = 0.8063EXP
(0.7156X-0.0392X
2
)
R
2
= 0.8794**
20
10
0
4
2
6
8
9
Panicle number (plant
-1
)
FIGURE 1.10
Relationship between panicle number and grain yield of upland rice.
means that 81% variability in grain yield was accounted as due to panicle number. Panicle number
per unit area is considered as one of the important yield components in increasing upland rice yield
(Fageria, 2007, 2009). Panicle length varied from 13.9 to 20.8 cm with an average value of 17.7 cm
at low N level. Similarly, at high N level, panicle length varied from 18.4 to 26.6 cm with an average
value of 22 cm. Overall, the increase in panicle length at higher N level was 24% compared with
low N level. Panicle length (X) was having significant (P < 0.01) quadratic relationship with grain
yield (Y = −110.5796 + 9.9081X-0.1299X
2
, R
2
= 0.43
**
). Yoshida (1981) reported that the number of
spikelets or grain per unit area of rice crop is positively correlated with the amount of N absorbed
by the end of spikelet initiation stage or by flowering.
In small grains, N generally increases the number of tillers, resulting in a greater number of
ears per unit land area (Halse et al., 1969; Pushman and Bingham, 1976). In cases where the ear
number is little affected, N may then cause an increase in the ear weight of up to 70 per cent over
the control (Gasser and Iordanou, 1967; Spratt and Gasser, 1970). That can result from an increase
in the number of spikelets per ear if the N is applied early (Holmes, 1973; Langer and Liew, 1973;
McNeal et al., 1971; Pearman et al., 1977). Grain weight generally shows much less variation than
grain number with the application of N (Novoa and Loomis, 1981).
The pod number of dry bean was significantly influenced by N and genotype treatments and their
interactions (Table 1.11). Pod number varied from 4.3 to 13.7 per pot at zero N rates with an average
value of 7.2 across 20 genotypes. The increase in pod number was 3.6-fold at 400 mg N treatment
compared to zero N treatment across 20 genotypes. Although F-test showed a significant influence
of genotype and N × G interaction, however, genotypes were not differentiated in relation to the pod
number by Tukey's test at lower and higher N rates.
2000
1500
1000
Y = -1115.0250 + 502.5515X - 22.2963X
2
R
2
= 0.6697**
500
0
4
6
8
10
12
14
Pods (plant
-1
)
FIGURE 1.11
Relationship between pods and grain yield of dry bean. (Adapted from Fageria, N. K. 2007.
J.
Plant Nutr
. 30:843-879. With permission.)