Agriculture Reference
In-Depth Information
TABLE 7.7
Root Dry Weight (g Plant
−1
) of 15 Dry Bean Genotypes at Different N and Rhizobium
Inoculation Treatments
Genotype
N
0
N
1
N
2
N
3
Average
Aporé
0.44bcdef
0.23def
0.26ef
0.58bcde
0.37cde
Pérola
0.33def
0.37bcd
0.26ef
0.56bcde
0.38cde
BRSMG Talisma
0.56bc
0.19f
0.29de
0.54bcde
0.39bcde
BRS Requinte
0.52bcde
0.25cdef
0.42abc
1.13a
0.58a
BRS Pontal
0.49bcdef
0.32cdef
0.47ab
0.51bcde
0.45bc
BRS 9435 Cometa
0.55bcd
0.39bcde
0.25ef
0.83ab
0.50ab
BRS Estilo
0.52bcde
0.38abc
0.31cde
0.57bcde
0.44bcd
CNFC 10408
0.28f
0.49ab
0.29de
0.24e
0.33e
CNFC 10470
0.27f
0.21ef
0.17f
0.21e
0.21f
Diamante Negro
0.66ab
0.54a
0.42abc
0.69bcd
0.57a
Corrente
0.41cdef
0.29cdef
0.36bcde
0.42cde
0.37cde
BRS Valente
0.31ef
0.32cdef
0.29de
0.41cde
0.33de
BRS Grafite
0.80a
0.39abc
0.38bcd
0.78abc
0.58a
BRS Marfim
0.40cdef
0.40abc
0.50a
0.47bcde
0.44bcd
BRS Agreste
0.41cdef
0.28cdef
0.27def
0.35de
0.33e
Average
0.46b
0.33c
0.33c
0.55a
F-test
N levels (N)
**
Genotypes (G)
**
N × G
**
CVN (%)
19.89
CVG (%)
18.72
Source:
Adapted from Fageria, N. K. et al. 2014.
Commun. Soil Sci. Plant Anal
. 45:111-125.
**Significant at the 1% probability level. Means in the same column followed by the same letter are not significantly different
at the 5% probability level by Tukey's test. Average values were compared in the same line for significant differences among
N rates. N
0
= 0 mg N kg
−1
(control); N
1
= 0 mg N kg
−1
+ inoculation with rhizobial strains; N
2
= inoculation with rhizobial
strains + 50 mg N kg
−1
; and N
3
= 200 mg N kg
−1
.
BRS Pontal
mg N kg
-1
0
0 + inoc
inoc + 50
200
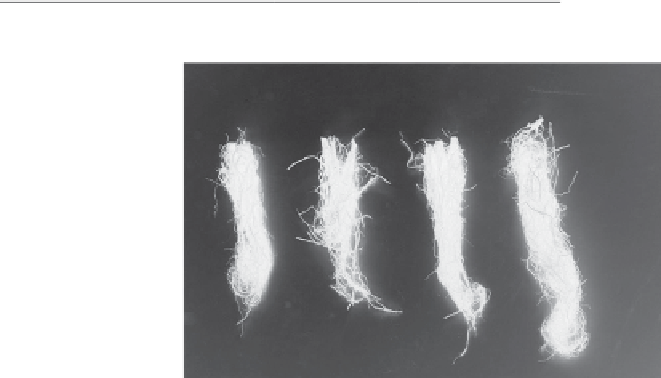
FIGURE 7.1
Root growth of dry bean genotype BRS Pontal at different N treatments. Left to right,
0 mg N kg
−1
, 0 mg N kg
−1
+ inoculant, inoculant + 50 mg N kg
−1
, and 200 mg N kg
−1
. (Adapted From Fageria,
N. K. et al. 2014.
Commun. Soil Sci. Plant Anal
. 45:111-125.)