Agriculture Reference
In-Depth Information
blocks. They are a part of the nucleic acids (DNA and RNA) that respectively hold the genetic infor-
mation and direct protein synthesis (Bould et al., 1984). Because N is contained in the chlorophyll
molecule, a deficiency of N will result in a chlorotic condition of the plant (Bennett, 1993). N is
also a structural constituent of cell walls (Schrader, 1984). N is important in sucrose synthesis and
in many reactions involving the utilization of sucrose as an energy source for plant growth and cell
maintenance (Zinati et al., 2001). Hence, N deficiency in plants will have a profound influence on
growth and development and consequently yield.
1.2.1 I
mprovement
In
G
rowth
, Y
Ield
,
and
Y
Ield
C
omponents
and
r
elated
t
raIts
In
C
ereals
and
l
eGumes
Before discussing the role of N in determining yield and yield components of crops, it is neces-
sary to discuss what is yield and the relationship between yield and yield components. Yield is one
of the most important measurements of a crop plant's economic value (Fageria, 2009). Yield is
defined as the amount of a specified substance produced (e.g., grain, straw, and total dry matter)
per unit area (Soil Science Society of America, 2008). Yield is generally expressed in kg ha
−1
or
Mg ha
−1
(or metric ton ha
−1
). In modern cropping systems, sustainability of yield is very important.
Yield sustainability is defined as a continual, annual, or periodic yield of plants or plant material
from an area, implied management practices that will maintain the productive capacity of the land,
be economically feasible, and maintain environmental integrity of the ecosystem (Soil Science
Society of America, 2008).
The yield in crop plants is genetically determined and also influenced by environmental fac-
tors (Fageria, 2013, 2014). Among environmental factors, the supply of essential plant nutrients
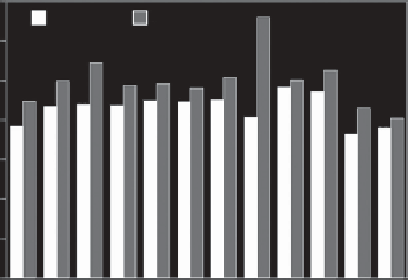
in adequate amount and proportion is very important. Figure 1.4 shows grain yield and shoot dry
weight or straw yield among 12 lowland rice genotypes. They were grown under similar field con-
ditions for two consecutive years. However, genotypes showed significant variability in the grain
yield and shoot dry weight (Figure 1.4). The shoot dry weight varied from 6602 kg ha
−1
for geno-
type CNAi 8569 to 4041 kg ha
−1
for genotype BRS Biguá, with an average value of 4980 kg ha
−1
.
Similarly, a variation in grain yield was from 4828 kg ha
−1
for genotype BRSGO Guará to 3638 kg
ha
−1
for genotype BRS Jaburu, with an average value of 4287 kg ha
−1
. A variation in grain yield of
7000
a
Grain
Shoot
6000
ab
ab
b
b
b
5000
b
b
b
a
ab
ab
b
ab
ab
ab
ab
ab
b
ab
b
4000
ab
ab
b
3000
2000
1000
0
Lowland rice genotypes
FIGURE 1.4
Grain and shoot dry weight of 12 lowland rice genotypes. Values are averages of 2 years
field experimentation. (Adapted from Fageria, N. K., A. B. Santos, and V. A. Cutrim. 2008.
J. Plant Nutr.
31:788-795. With permission.)