Agriculture Reference
In-Depth Information
CO(NH
2
)
2
polymer
CO(NH
2
)
2
polymer
CO(NH
2
)
2
polymer
mg N kg
-1
0
100
200
400
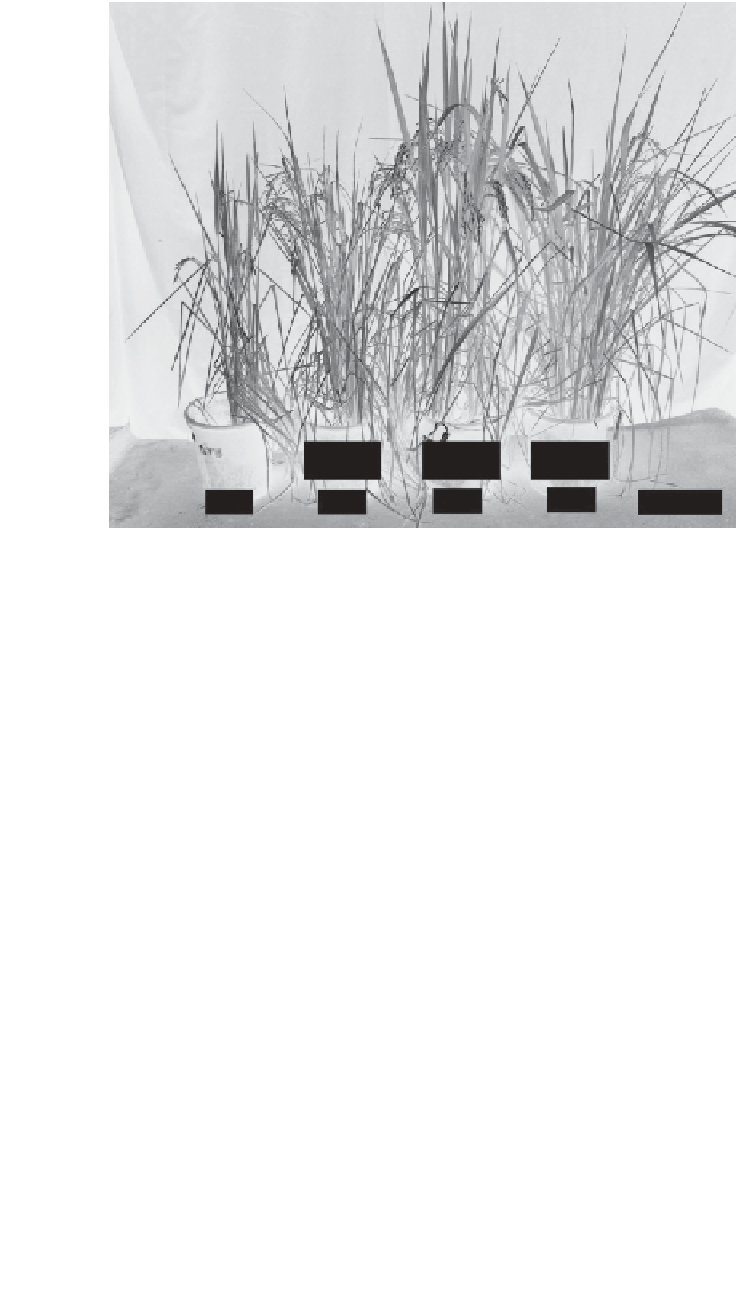
FIGURE 3.35
(
See color insert.
) Response of lowland rice to nitrogen fertilization applied with polymer-
coated urea. Half of the N was applied at sowing and the remaining half at the active tillering growth stage.
TABLE 3.17
Grain Yield and Panicle Number of 12 Lowland Rice Genotypes as Influenced by N Rate
and Genotype Treatments
Grain Yield (g Plant
−
1
)
Panicle Number (Plant
−
1
)
Genotype
0 mg N kg
−
1
300 mg N kg
−
1
0 mg N kg
−
1
300 mg N kg
−
1
BRS Tropical
12.53abc
24.43a
7.25abcd
15.00a
BRS Jaçanã
15.16a
20.47cd
7.08abcd
13.50ab
BRA 02654
14.27ab
22.63ab
7.75ab
13.91ab
BRA 051077
13.54abc
21.91bc
6.33bcde
14.00ab
BRA 051083
13.17abc
22.34bc
8.08a
14.33a
BRA 051108
14.80ab
22.07bc
7.50abc
14.00ab
BRA 051126
12.45abc
19.61de
6.42bcde
12.48bc
BRA 051129
11.09cd
18.10ef
5.25e
11.33cd
BRA 051130
13.00abc
22.37bc
5.83de
13.33ab
BRA051134
12.28bc
18.02ef
5.00e
10.00d
BRA 051135
9.12d
17.05f
6.00cde
10.00d
BRA 051250
13.61abc
21.91bc
6.50abcde
12.25bc
Average
12.92b
20.91a
6.58b
12.85a
F-test
N rate (N)
**
**
Genotype (G)
**
**
**
**
N × G
CV (%) N rate
4.23
7.28
CV (%) genotype
4.91
5.84
**Significant at the 1% probability level. Means followed by the same letter in the same column are not significantly different
at the 5% probability level by Tukey's test.