Agriculture Reference
In-Depth Information
15.7 g kg
−1
at the 400 mg N level. There was an 18% increase in N concentration in shoots at a higher
N level compared to a low N level. Similarly, the average N concentration in grains was 43.6 g
kg
−1
at a low N level and 46.9 g kg
−1
at a high N level. The increase in N concentration at a high N
level was 7.6% compared to a low N level across 20 genotypes. The average nitrogen concentration
value in the shoot (15.7 g kg
−1
) and the grain (46.9 g kg
−1
) at a high N level can be considered as an
adequate level for the bean crop. Similarly, adequate values of N concentration in bean shoots have
been reported by Fageria (1989a) and Piggott (1986). Nitrogen concentration in the grain was about
three times more compared with N concentration in the shoot at low as well as high N rates. Similar
results have been reported by Fageria (1989) and Fageria et al. (2011a).
3.4.2 n
ItroGen
u
ptake
In
p
lants
Nitrogen uptake is defined as the quantity of N taken up from the growth medium by plants at a
determined growth stage. The uptake of nutrient in crop plants is determined by the analysis of
straw and grain separately at harvest and expressed in kg ha
−1
. It is determined by the multiplication
of concentration with dry matter, which includes both grain and straw. Nutrient uptake, including
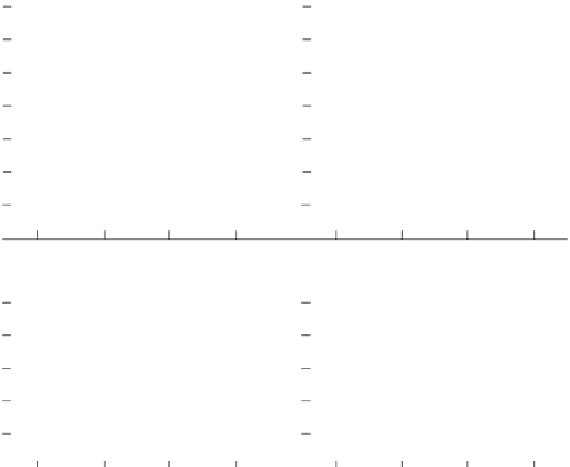
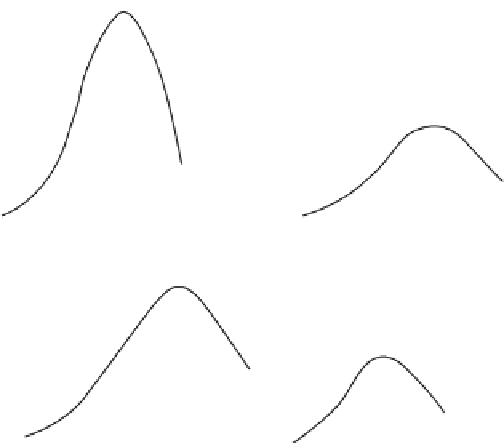
N, increased with increasing plant age of crop plants in a quadratic fashion, Figure 3.28. The most
appropriate growth stage to determine N uptake is at the harvest of crop plants because straw and
grain yield are maximum at this growth stage. Nitrogen uptake data serve as a measurement of soil
fertility depletion. They can also be used to determine how much N a crop requires to produce a
determined yield. Data related to the uptake of nutrients, including N by upland rice, dry bean, corn,
and soybean, are presented in Table 3.7. In addition, information on the uptake of macro- and micro-
nutrients to produce 1 metric ton of grain is also presented. It is clear from these data that N uptake
by all crops is significant and substantial except in the cases of upland and lowland rice. Similarly,
Y = 0.1903EXP
(0.1202X-0.00101X
2
)
R
2
= 0.9629**
240
200
Corn
Upland rice
Y = 0.7277EXP
(0.1062X - 0.00056X
2
)
R
2
=0.9706**
160
120
80
40
0
Y = 0.3161EXP
(0.0972X-0.00041X
2
)
R
2
= 0.9633**
Y = 1.0701EXP
(0.1187X-0.00089X
2
)
R
2
= 0.9045**
100
Soybean
Dry bean
80
60
40
20
0
20
60
140
0
20
60
100
140
100
Days after sowing
FIGURE 3.28
Nitrogen accumulation in the straw of four crop species. (Adapted from Fageria, N. K. 2004.
Commun. Soil Sci. Plant Anal
. 35:961-974.)