Agriculture Reference
In-Depth Information
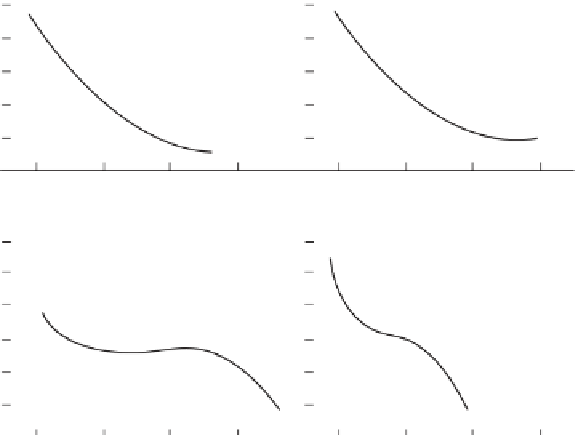
Generally, nutrient concentration in most tissues of crop plants decreased with increasing plant
age. A relationship between plant age and N concentration in the tissue of corn, upland rice, soy-
bean, and dry bean is shown in Figure 3.27. Nitrogen concentration in four crops decreased with
increasing plant age. The decreasing trend was different between cereals and legumes. The decrease
in N concentration with plant age was expected because, with increasing plant age, more dry mat-
ter was produced, diluting the concentration of nutrients accumulated (Fageria, 2009). Barker and
Bryson (2007) also reported that the concentrations of N in leaves, stems, and roots change during
the growing season. In the early stages of growth, concentrations will be high throughout the plant.
As plants mature, the concentrations of N in these organs fall and are usually independent of the
initial external supply of N. If the development of a plant is restricted by low levels of external fac-
tors, such as other nutrients, water, or temperature, the internal concentration of N may rise (Barker
and Bryson, 2007). Table 3.4 shows the average adequate concentrations for essential nutrients in
crop plants. No doubt these values vary with the soil, climate, crop, and management practices, and
it is very difficult to make generalizations. Generalized values do give the reader some idea about
what levels of nutrients are adequate in crop plants.
Various studies have indicated that plant N concentration declines as plants grow (Greenwood
et al., 1986; Lemaire and Gastal, 2009; Yue et al., 2012a). This decline in N is described by a
negative power function called the dilution curve: N = aW
−b
, where W is the aboveground biomass
or dry matter (DM), expressed in Mg DM ha
−1
, N is the N
c
in aboveground DM, expressed in %
DM, a represents plant N concentration in percent when the crop mass is 1 Mg DM ha
−1
, and b
represents the dilution coefficient (Greenwood et al., 1990). Greenwood et al. (1990) defined two
general critical N dilution curves when W is >1 Mg DM ha
−1
. One is for C3 crop species, that is,
N
c
= 5.7 W
−0.5
. This curve value is valid for tall fescue (
Festuca arundinacea
Schreb.), Lucerne
(
Medicago sativa
L.), potato (
Solanum tuberosum
L.), wheat (
Triticum aestivum
L.), and rape
Y = 57.1775 - 0.8107X + 0.0033X
2
R
2
= 0.9623**
Y = 60.2214 - 0.7333X + 0.0031X
2
R
2
= 0.9637**
50
Upland rice
Corn
40
30
20
10
Y = 80.7371EXP
(-0.0441X+0.00056X
2
-0.0000027X
3
)
R
2
= 0.8744**
Y = 117.6970EXP
(-0.0735X+0.0014X
2
-0.0000096X
3
)
R
2
= 0.9723**
50
Soybean
Dry bean
40
30
20
10
0
20
60
100
140
20
Days after sowing
0
60
100
140
FIGURE 3.27
Relationship between plant age in days and nitrogen concentration in plant tissue of corn,
upland rice, soybean, and dry bean. (Adapted from Fageria, N. K. 2004.
Commun. Soil Sci. Plant Anal
.
35:961-974.