Information Technology Reference
In-Depth Information
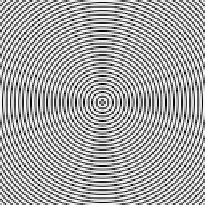
(a)
f
ex
1
(b)
f
ex
2
(c)
f
ex
3
Fig. 9
Original test images on square lattices. Note that the luminance of
f
ex
1
varies slowly.
Ta b l e 3
Errors for
f
ex
1
,
R
1
=
1000
Filter
Mean
Variance
Max
Min
Gradient intensity
Sqr 3
×
3 4.39986E-8
2.47255E-16 6.64841E-8
7.25474E-10
Sqr 5
×
5 3.33738E-7
1.40526E-14 5.02276E-7
5.53689E-9
Hex 1
3.03035E-8
1.17287E-16 4.58079E-8
5.00000E-10
Hex 2
5.78494E-8
4.12577E-16 8.64151E-8
9.71484E-10
Orientation by arctan (radian)
Sqr 3
×
3 1.15054E-10 8.60308E-21 3.60189E-10 0.00000E0
Sqr 5
×
5 1.72864E-11 1.93587E-22 5.41087E-11 0.00000E0
Hex 1
4.18671E-13 3.32438E-25 1.11029E-11 0.00000E0
Hex 2
2.45733E-13 1.12628E-25 6.12340E-12 0.00000E0
Orientation by Overington's method (radian)
Sqr 3
×
3 1.52959E-3
3.05383E-6
6.15061E-3
5.61363E-15
Sqr 5
×
5 1.52959E-3
3.05383E-6
6.15061E-3
5.61363E-15
Hex 1
1.52469E-3
3.01695E-6
6.14350E-3
0.00000E0
Hex 2
1.52469E-3
3.01695E-6
6.14350E-3
0.00000E0
Moreover, the means of error of gradient intensity, orientation detection (using
arctangent) and orientation detection (by Overington's method) are shown in Figure
13(a),(b) and (c), respectively.
9
Discussion
Generally speaking, the computational cost of extracting the gradient value of a
pixel on a hexagonal lattice is higher than that for a square lattice, because hexagonal
lattices use three axes, while square lattices use two axes. However, the results show
our filters on hexagonal lattices have many advantages with respect to accuracy.
The most accurate results for gradient intensity were obtained when the radius-
1 gradient filter on hexagonal lattices was used for all test images. The smaller the


Search WWH ::

Custom Search