Information Technology Reference
In-Depth Information
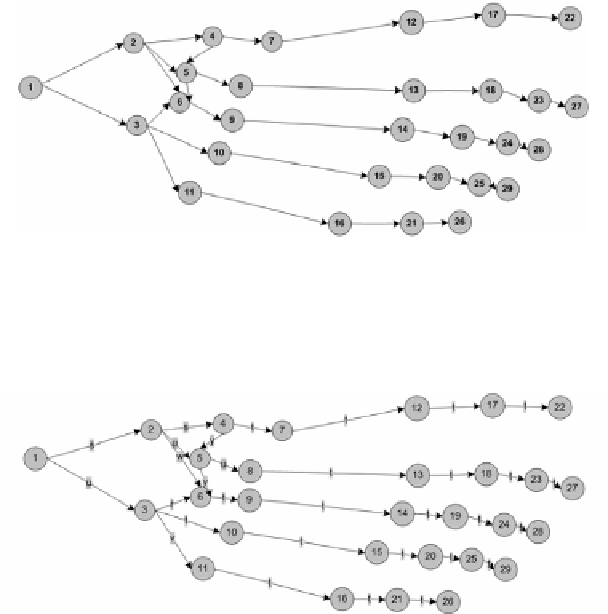
Figure 9 shows the graph of relations between individual tarsus, metatarsus and
phalanx bones.
Fig. 9
A relation graph of foot bones in the dorsopalmar projection
Figure 10 shows the graph of relations between individual tarsus, metatarsus
and phalanx bones including the angles of slopes between individual foot bones.
Fig. 10
A relation graph in the dorsopalmar projection
This definition method allows the UBIAS system to start analysing image data.
Selected results of its operation are illustrated by Figures 11-16, which, to
comprehensively present the universality of the analysis, show selected examples
of automatic image data interpretation and their semantic interpretation.
For a comparison, the authors have chosen the following medical images used
for cognitive data interpretation with the application of graph formalisms to
analyse images showing various foot bone lesions.
Figure 11 shows an example of the automatic analysis of an image depicting a
fracture of os naviculare.
Search WWH ::

Custom Search