Information Technology Reference
In-Depth Information
CTP is one of techniques used to assess cerebral circulation in acute stroke
patients. Similar to MR perfusion (MRP), CTP is widely applied for assessing
perfusion abnormalities of stroke patients, including candidates for thrombolytic
therapy [29]. Perfusion-weighted CT (computed tomography) and MR (magnetic re-
sonance) techniques - in contrast to those of MR and CT angiography, which detect
bulk vessel flow - are sensitive to microscopic, tissue-level blood flow [1].
During the perfusion treatment after a bolus venous injection of a contrast agent
a series of CT scans on a specific plane is acquired. This series is used for genera-
tion a set of TDC (Time Density Curve). Analyzing those TDC gives a variety of
functional maps (term perfusion maps and perfusion images will be used as the
synonyms) of cerebral perfusion parameters such as regional Cerebral Blood Flow
(CBF), Cerebral Blood Volume (CBV) and Mean Transit Time (MTT). In order to
generate those maps the Meier-Zierler model is commonly used [39]. It is possible
to use this model if the blood flow is constant and the contrast enhancement is li-
nearly dependent on the contrast concentration. Each pixel of a perfusion map cor-
responds to the value of perfusion in the given point. The color images help quick
diagnosis of an acute stroke in the event of a crisis (Fig 1).
There are many commercial applications that can be used in order to generate
perfusion maps [29]. The author uses Syngo Neuro Perfusion CT software by
Siemens.
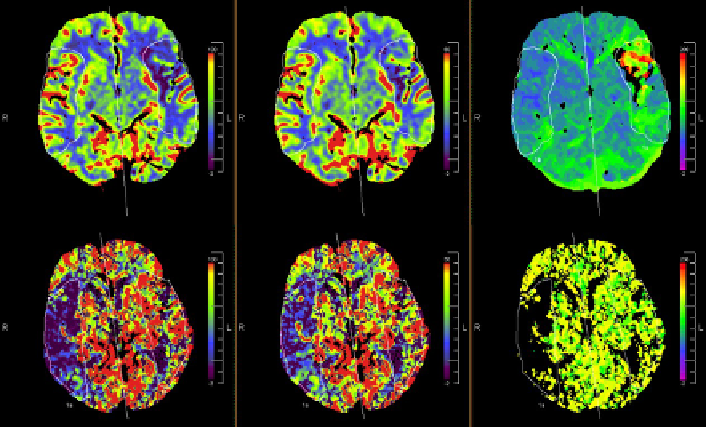
Fig. 1
Example brain perfusion maps. From left to right: CBF, CBV and TTP (each row for
different patient). Both sets show severe ischemic abnormalities (dark blue or black asym-
metrical regions) in right (top row) or left (bottom row) hemispheres (left hemisphere is in
the right side of perfusion image).
Search WWH ::

Custom Search