Information Technology Reference
In-Depth Information
been defined by introducing the appropriate spatial relations: vertical - defined by
the set of labels {α, β,…, μ} and horizontal - defined by the set of labels {1, 2,…,
24} on a hypothetical sphere surrounding the heart muscle. These labels designate
individual final intervals, each of which has the angular spread of 15
. Then, de-
pending on the location, terminal edge labels are assigned to all branches identi-
fied by the beginnings and ends of the appropriate sections of coronary arteries.
The presented methodology draws upon the method of determining the location of
a point on the surface of our planet in the system of geographic coordinates, where
a similar cartographic projection is used to make topographic maps. The use of the
presented methodology to determine spatial relations for the analysed projection is
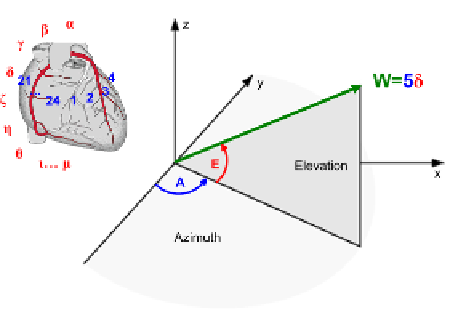
shown below (fig. 7.).
°
Fig. 7
Procedure of identifying spatial relations between individual coronary arteries
To determine the appropriate label for the vector W, its beginning should be
placed at the zero point of the coordinate system, and then its terminal point loca-
tion should be established. For this purpose, two angles have been defined: the
azimuth angle A to identify the location of the given point as a result of rotating
around the vertical axis and the elevation angle E which identifies the elevation of
a given point above the horizon. This representation of mutual spatial relations be-
tween the analysed arteries yields a convenient access to the unambiguous de-
scription of all elements of the vascular structure. At subsequent analysis stages,
this description will be correctly formalised using ETPL(k) graph grammars de-
fined in [3][16][18], supporting the search for stenoses in the lumen of arteries
forming parts of the coronary vascularisation. ETPL(k) grammars generate a lan-
guage L(G) in the form of IE graphs which can unambiguously represent 3D
structures of heart muscle vascularisation visualised in images acquired during di-
agnostic examinations with the use of spiral computed tomography. Quoted below
is the formal definition of the IE graph [3][16][18].
H=(V, E,
Σ
,
Γ
,
Φ
)
Search WWH ::

Custom Search