Database Reference
In-Depth Information
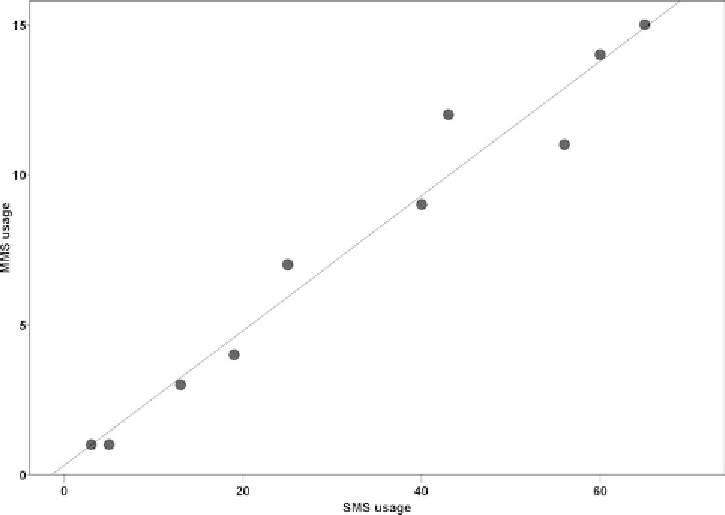
Figure 2.13
Linear correlation between two continuous measures.
usage also tend to be MMS users as well. These two services are related in a linear
manner and present a strong, positive linear correlation, since high values of one
field tend to correspond to high values of the other. However, in negative linear
correlations, the direction of the relationship is reversed. These relationships are
described by straight lines with a negative slope that slant downward. In such cases
high values of one field tend to correspond to low values of the other. The strength
of linear correlation is quantified by a measure named the Pearson correlation
coefficient. It ranges from -1 to
1. The sign of the coefficient reveals the
direction of the relationship. Values close to
+
1 denote strong positive correlation
and values close to -1 negative correlation. Values around 0 denote no discernible
linear correlation, yet this does not exclude the possibility of nonlinear correlation.
Factor analysis and PCA examine the correlations between the original input
fields and identify latent data dimensions. In a way they ''group'' the inputs into
composite measures, named factors or components, that can effectively represent
the original attributes, without sacrificing much of their information. The derived
components and factors have the form of continuous numeric scores and can be
subsequently used as any other fields for reporting or modeling purposes.
+
Search WWH ::

Custom Search