Database Reference
In-Depth Information
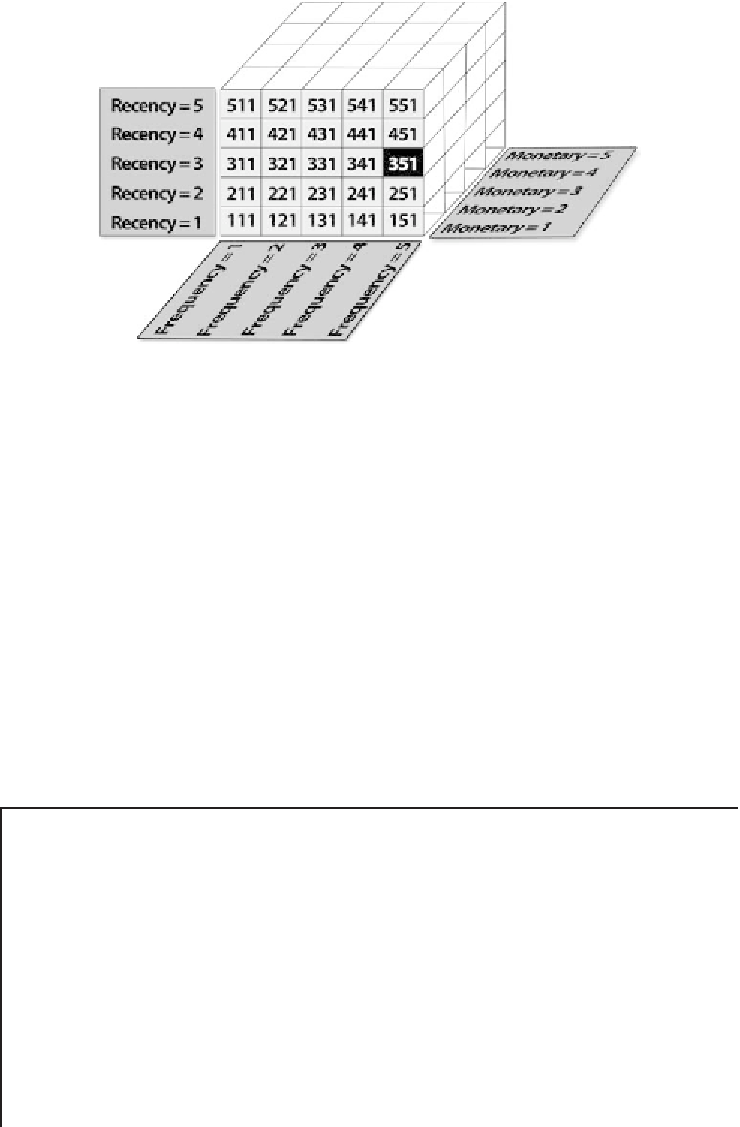
Figure 8.2
The total RFM cells in the case of binning into quintiles (groups of 20%).
When grouping customers in quintiles (groups of 20%), the procedure results
in a total of 5
125 RFM cells as displayed in Figure 8.2.
This combination of the R, F, and M components into cells is widely used,
though it does have a certain disadvantage. The large number of derived cells
makes the procedure quite cumbersome and hard to manage. An alternative
method for segmenting customers according to their RFM patterns is to use the
respective components as inputs in a clustering model and let the algorithm reveal
the underlying natural groupings of customers.
The marketers of the retail enterprise decided to perform RFM analysis,
before proceeding to the development of a more general multi-attribute segmen-
tation scheme. The procedure followed is presented in ''The RFM Segmentation
Procedure''.
×
5
×
5
=
Combining R, F, and M Components to Derive a Continuous RFM Score
An alternative approach treats the binned R, F, and M components as
continuous measures. According to this approach, the R, F, and M bins
are summed, with appropriate user-defined weights, in order to provide
a continuous RFM score. The RFM score is the weighted average of its
individual components and is calculated as follows:
RFM score
=
(
recency score
×
recency weight
)
+
(
frequency score
×
frequency weight
)
+
(
monetary score
×
monetary weight
)
.

Search WWH ::

Custom Search