Database Reference
In-Depth Information
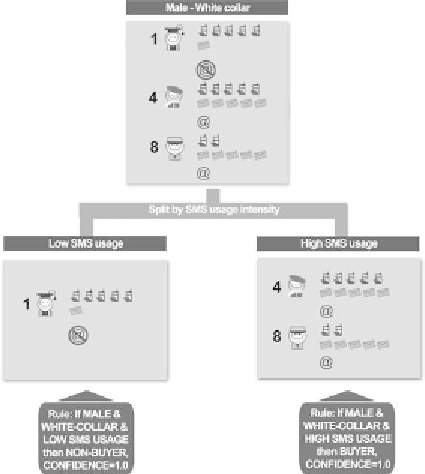
Figure 3.23
Final splits of the decision tree and the last terminal nodes.
deliberately kept it as simple as possible by presenting only faultless rules and
by eliminating uncertainties due to model errors and misclassifications. In real
projects we would not dare to split nodes with just a handful of records. Moreover,
the resulting terminal nodes would rarely be so homogeneous. Terminal nodes
typically include records of all the outcome categories but with increased purity
and decreased diversity in the distribution of the categories of the outcome,
compared to the overall population. In these situations the majority rule (modal
category) defines the prediction of each terminal node. In real-word applications,
models make errors. They misclassify cases and inevitably produce confidence
values lower than 1.0. That is why data miners should thoroughly evaluate the
performance of the resulting models and assess their predictive ability before
deployment.
Figure 3.24 summarizes the entire tree growth procedure of our example,
from the root node up to the terminal nodes.
The following figures show what the decision tree model results look like
in real life. The first figure (Figure 3.25) presents the model results in the Tree
format while the second one (Figure 3.26) presents the results in the equivalent
Search WWH ::

Custom Search