Database Reference
In-Depth Information
Table 3.13
The means of original attributes of particular importance for each cluster.
Clusters
Cluster Cluster Cluster Cluster Cluster Cluster Total
1
2
3
4
5
6
VOICE CALLS
345.3
329.1
105.5
133.8
136.7
107.4
165.6
SMS CALLS
292.9
44.9
128.1
42.3
57.8
7.8
55.4
VOICE ROAM-
ING CALLS
104.5
1.3
0.8
25.7
1.2
0.4
3.5
MMS CALLS
8.4
0.5
0.3
0.2
4.1
0.1
0.7
GPRSTRAFFIC
807.0
55.7
34.9
21.3
310.4
16.9
62.4
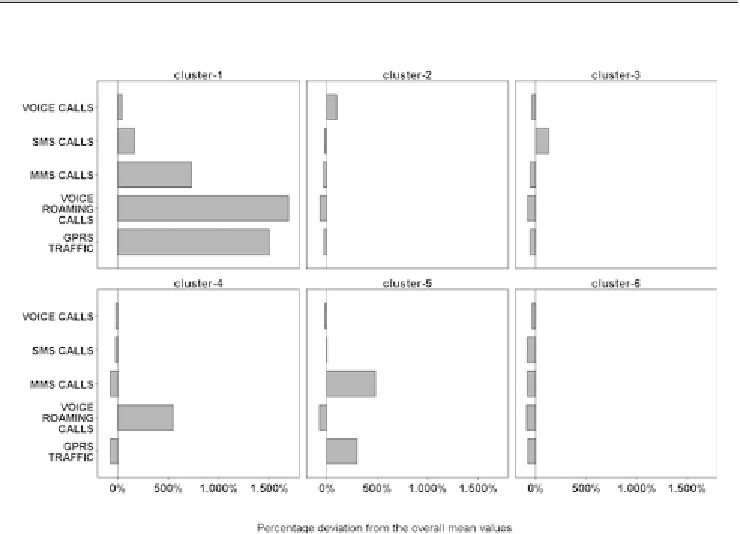
Figure 3.18
Percentage deviation of each cluster from the overall mean values.
Simple scatterplots which place the cases of each cluster within the axes
defined by selected attributes are also typically employed for visualization of the
clusters' structure. The next set of scatterplots in Figure 3.20 graphically illustrates
the relationship of the clusters in our example with voice and SMS usage. Due to
the large size of the customer population, the scatterplots are based on a random
sample of the assigned records. Moreover, the values of the selected attributes are


Search WWH ::

Custom Search