Geology Reference
In-Depth Information
that the recharge varied as it had done between 1986 and 2002.
In both scenarios, the water demand was set constant and equal to the one
in 2002.
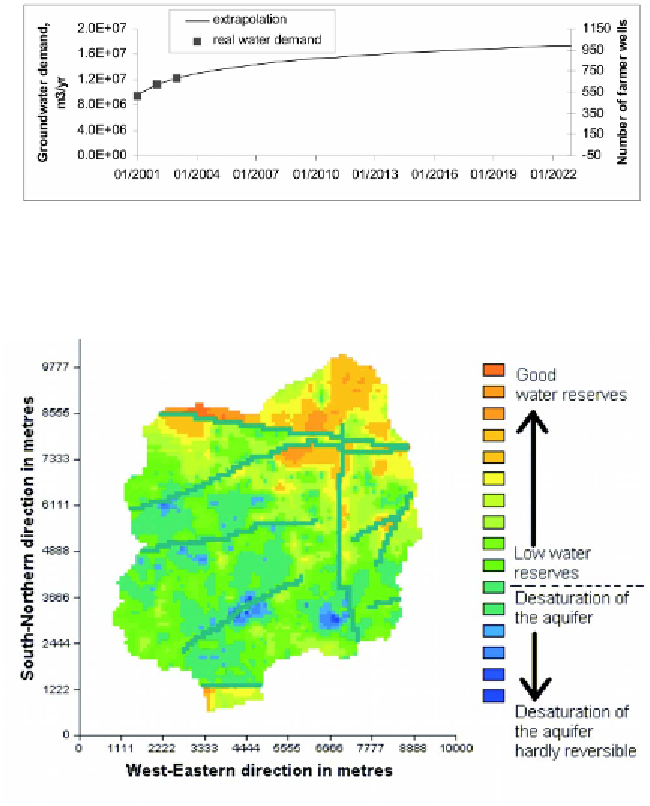
If the water demand increases, the scheme is different. Figure 10 shows
an extrapolation of the water demand over the next 20 years. This figure is
only an example. It proposes a logarithmic increase in the water demand
justified by the assumption that the yearly increase of the number of wells
will decrease due to a saturation of the land use. With this figure, the number
of wells located in the watershed will have increased from 709 to 1004 in
January 2023.
Figure 10.
Anticipated water demand for the next 20 years.
Predictions were made with this new scenario. The groundwater level
decreases rapidly (Figure 11). In the longer term (a few more years), the
Figure 11.
Groundwater status in 2023.