Geology Reference
In-Depth Information
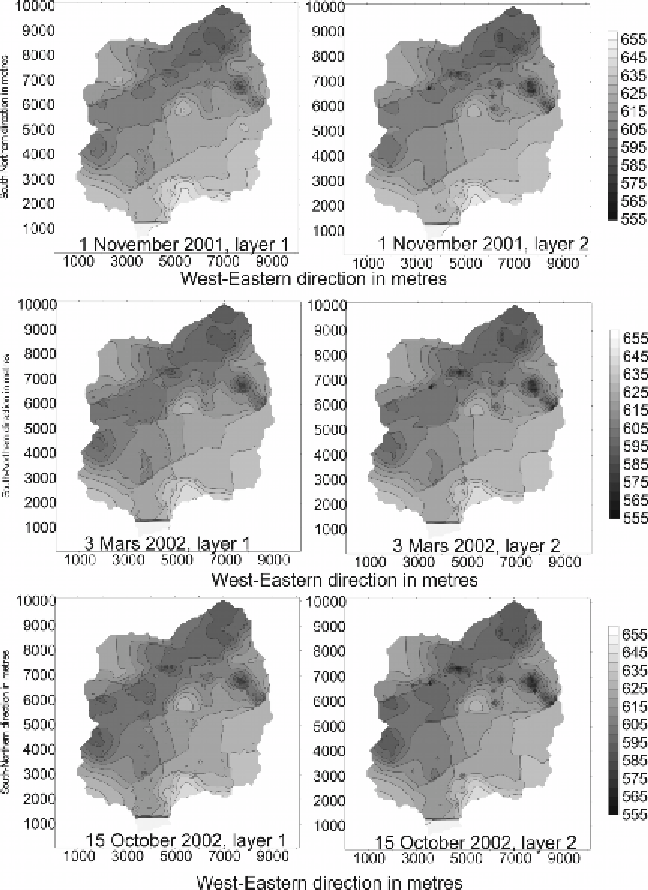
Figure 9.
Simulated water levels for layers 1 and 2.
Figure 9 presents some simulated water-level maps for both layers. There
is not much difference in the water levels between layer 1 and layer 2 except
in the zone of large groundwater withdrawals where layer 2 shows lower
hydraulic heads than layer 1.
Some predictive scenarios were tested until the year 2023 assuming:
that the recharge was set at a constant value equivalent to the average of
the recharge calculated between 1986 and 2002; and