Geology Reference
In-Depth Information
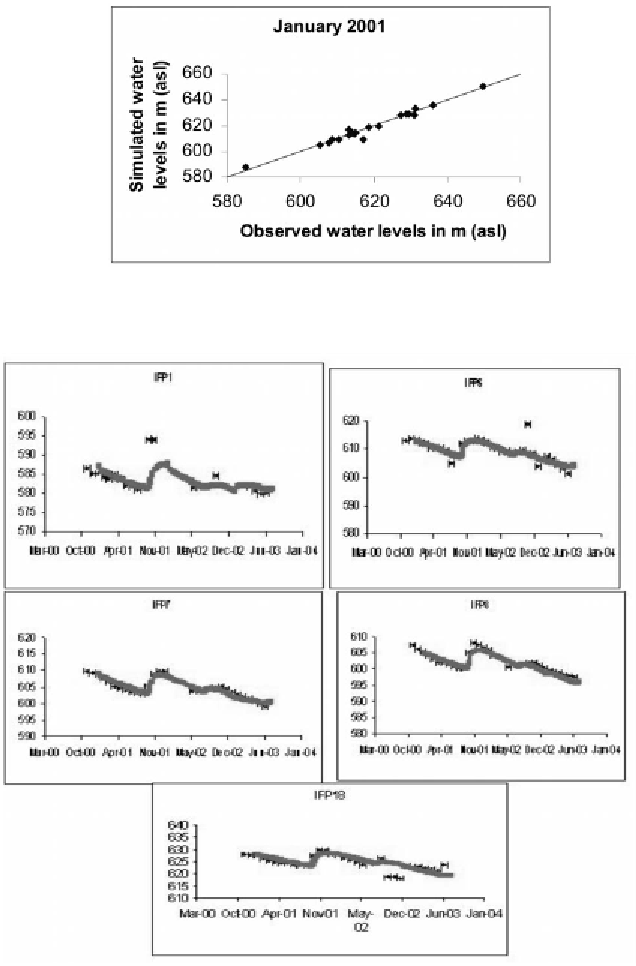
simulated groundwater levels in the transient condition shows a satisfactory
calibration as the differences (Fig. 8) are more or less in the tolerance limit.
Figure 7.
Comparison between simulated and calculated heads for
January 2001 in Steady State Simulation.
Figure 8.
Comparison of the simulated groundwater levels
(continuous line) and observed ones (stars).