Geology Reference
In-Depth Information
regularly each month (Fig.1). The water level varies from 580 m to 640 m
(amsl) which follows the topography of the area.
DISCUSSION AND CONCLUSIONS
The standard deviation maps (Figs 2 and 3) obtained by 56 observation wells
and also the optimal number of 40 observation wells obtained after optimal
network design from the area with grid size of 500 m × 500 m looks very
similar which shows that the network so finally obtained after geostatistical
optimization reproduce the complete water level fluctuation of the watershed.
The statistics of standard deviation (
) obtained after using krignet
(Table 2) shows in good agreement with both cases i.e., when there are 56
and 40 observation wells. This has also been tested in a smaller grid of grid
size 250 m × 250 m. The final map shows the optimized well location
(Fig. 4). Similar work was carried out by Sophocleous et al. (1982). In their
work the error analysis produced by universal kriging indicates that a
significant reduction in the number of wells could be achieved by employing
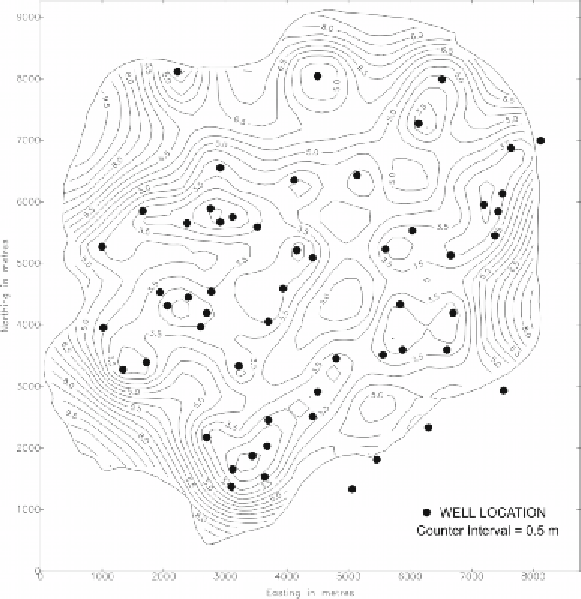
Figure 2.
Contour map of sigma (in m) with 56 measurements
points (500 m × 500 m).