Agriculture Reference
In-Depth Information
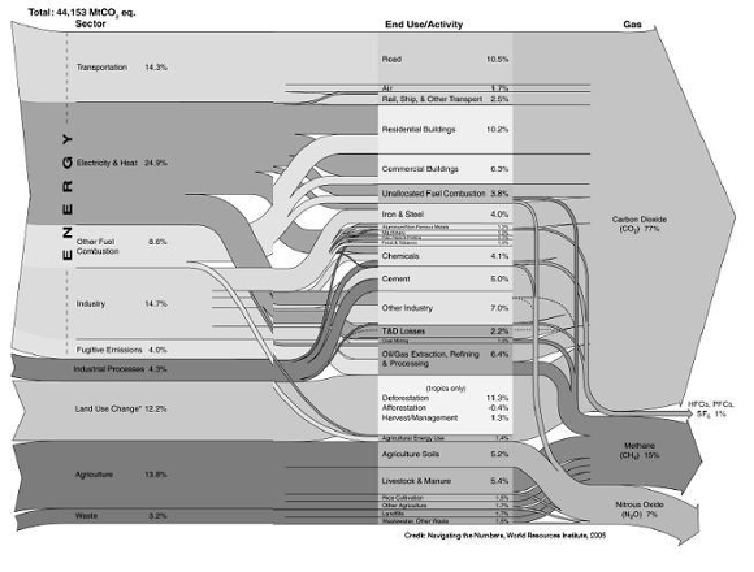
Sources and Notes:
All data are for 2005. All calculations are based on CO
2
equivalents, using 100-year global
warming potentials from the IPCC (1996), based on a total global estimate of 44, 153 MtCO2 equivalent. See Appendix 2
of
Navigating the Numbers: Greenhouse Gas Data & International Climate Policy
(WRI, 2005) for a detailed description
of sector and end use/activity definitions, as well as data sources. Dotted lines represent flows of less tha 0.1% of total
GHG emissions.
* Land Use Change includes both emissions and absorptions, and is based on analysis that uses revised methodolo-
gies compared to previous versions of this chart. These data are subject to significant uncertainties.
Nowhere in the report can I find any explanation of how the categories 'extensive' and
'intensive' are defined, nor are we told what proportion of the world's food is produced
by extensive and intensive systems respectively. However, a moment's perusal of the two
columns headed 'extensive' and 'intensive ' reveals one main difference between the two.
Nearly all the intensive emissions are related to activities that are heavily fossil fuel de-