Information Technology Reference
In-Depth Information
C
i
,
P
(
v
j
) is the probability that the
j
-th interpretation has the value
v
j
in the
training data, and
P
(
C
i
) is the probability of the training dataset belonging to
the class
C
i
.
We constructed an
ARFF
file [19] (i.e., Attribute Relation File Format) with
the resultant vector representations of the e-mails to build the aforementioned
WEKA's classifiers.
To evaluate the results, we measured the most frequently used for spam:
precision, recall and Area Under the ROC Curve (AUC). We measured the
precision of the spam identification as the number of correctly classified spam e-
mails divided by the number of correctly classified spam e-mails and the number
of legitimate e-mails misclassified as spam,
S
P
=
N
s→s
/
(
N
s→s
+
N
l→s
), where
N
s→s
is the number of correctly classified spam and
N
l→s
is the number of
legitimate e-mails misclassified as spam.
Additionally, we measured the recall of the spam e-mail messages, which is
the number of correctly classified spam e-mails divided by the number of cor-
rectly classified spam e-mails and the number of spam e-mails misclassified as
legitimate,
S
R
=
N
s→s
/
(
N
s→s
+
N
s→l
).
Finally, we measured the
Area Under the ROC Curve
(AUC), which estab-
lishes the relation between false negatives and false positives [20]. The ROC curve
is represented by plotting the rate of true positives (TPR) against the rate of
false positives (FPR). Where the TPR is the number of spam messages correctly
detected divided by the total number of junk e-mails,
TPR
=
TP/
(
TP
+
FN
),
and the FPR is the number of legitimate messages misclassified as spam divided
by the total number of legitimate e-mails,
FPR
=
FP/
(
FP
+
TN
).
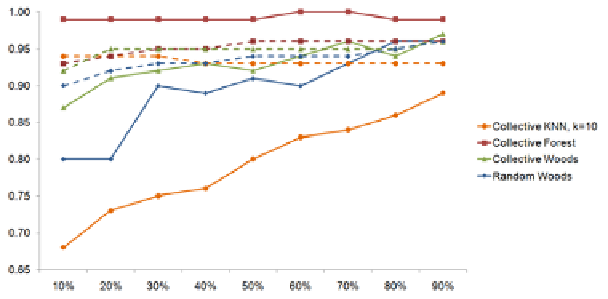
For our experiments we tested the different configurations of the collective
algorithms with sizes for the
set of known instances, varying from a 10% to a
90% of the instances used for training (i.e., instances known during the test).
Fig. 1 shows the precision of the different algorithms. Collective KNN shows
significant improvements with Ling Spam when the number of known instances
X
Fig. 1.
Precision of the evaluation of collective algorithms for spam filtering with dif-
ferent sizes for the
X
set of known instances. Solid lines correspond to Ling Spam and
dashed lines correspond to SpamAssassin.


Search WWH ::

Custom Search