Information Technology Reference
In-Depth Information
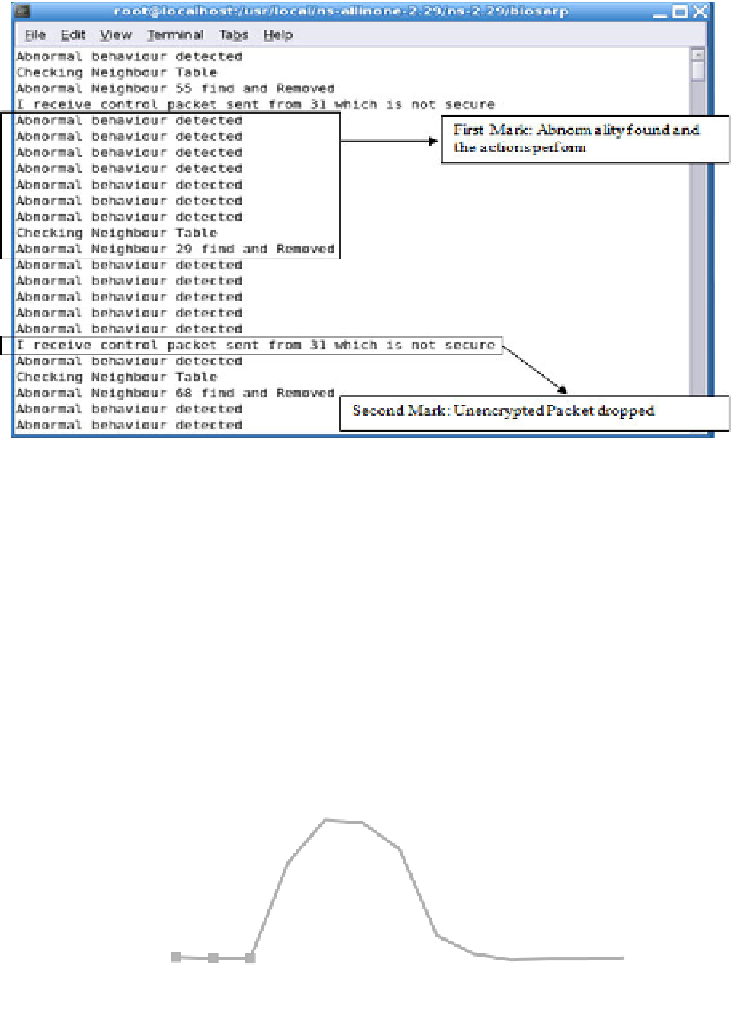
Fig. 3.
NS-2 showing the Abnormality and actions taken against certain nodes
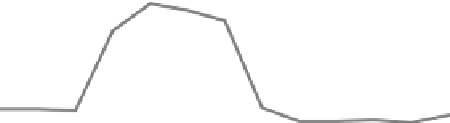
The simulation scenario is maintained as in [10] for BIOSARP and SAID
comparison. When network has suffered attack by 10 malicious nodes, the power
consumption value increased. Once the AIS self-security measure starts functioning,
the energy consummation starts to reduce. And as soon as the malicious nodes stop
attacking, the power consumption comes to the normal situation as observe at 450th
sec in Figure 4.
0.2
0.18
BIOSARP
SAID
0.16
0.14
0.12
0.1
0.08
0.06
0.04
0.02
0
0
50 100 150 200 250 300 350 400 450 500 550 600
Simulation Time (Sec)
Fig. 4.
BIOSARP & SAID Comparison in terms of Energy
Figure 5 shows the performance of BIOSARP as the number of compromised node
increases from 4 to 20. In Figure 5, the power consumption increases as the number of


Search WWH ::

Custom Search