Environmental Engineering Reference
In-Depth Information
Figure 5.7
Representation of the production of ozone from methane, carbon monoxide and
non-methane hydrocarbons
Source
: adapted from Lacis et al, 1990
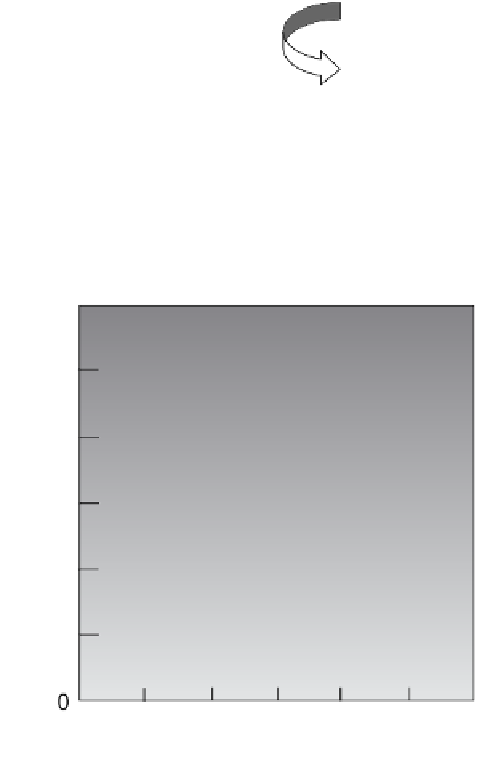
Figure 5.8
Change in temperature per ozone column amount (Dobson Units - DU) by
altitude
which infrared radiation is emitted and absorbed by O
3
. The maximum occurs at
the tropopause, where temperatures are at a minimum.
Using 3D inventories of aircraft emissions, such as that shown in Figure 5.4, it is
possible with a 3D chemical/transport model of the global atmosphere to calculate