Information Technology Reference
In-Depth Information
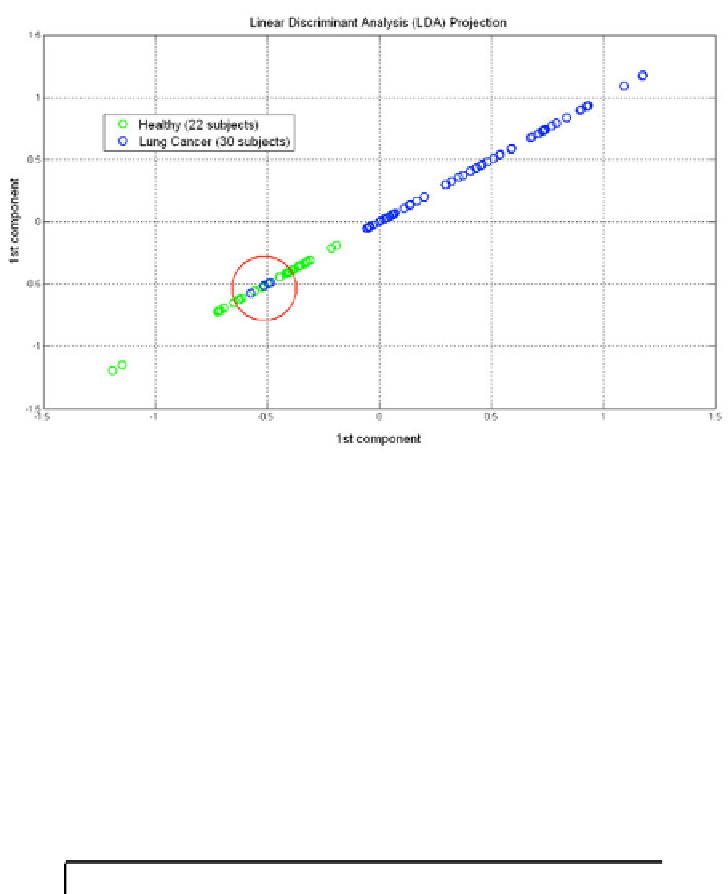
Fig. 5.
The results of dimensionality reduction through linear discriminant analysis
(LDA) into one component. As evident the separability between the two classes
healthy
subject
and
lung cancer patient
is very satisfactory. Samples in the red circle are the
misclassified four lung cancer patients erroneously assigned to the healthy class.
Table 2.
Confusion matrix and corresponding performance indexes obtained classi-
fying the dataset with the model proposed by the Genetic Algorithm (projection of
the seven features subset into one dimension by LDA and classification by
k
-NN with
k
= 9). Results have been obtained performing a leave-one-subject-out cross-validation
and confidence intervals have been computed for a probability of 95%. Positive samples
correspond to stage I lung cancer patients, while negative samples represent healthy
subjects. Performance are lower than those achieved in the classification
lung cancer pa-
tients
(all stages) versus
healthy subjects
, but this is probably due to the small available
dataset regarding the positive class and the imbalance between the two classes.
CONFUSION
TRUE LABELS
Accuracy
92
.
86%
±
8
.
51%
MATRIX
Positive Negative
Sensitivity
75%
±
34
.
31%
ESTIMATED Positive
9
1
Specificity
97
.
73%
±
4
.
57%
LABELS
Negative
3
43
Precision
POS
90%
±
40
.
15%
93
.
48%
±
13
.
39%
Total
12
44
Precision
NEG
This could be due both to the small available dataset (only 12 subjects affected
by stage I lung cancer) and to the imbalance of the dataset (12 stage I lung
cancer versus 44 healthy subjects). Regardless this analysis, the achieved results
suggest that the discrimination between
stage I lung cancer patient
and
healthy


Search WWH ::

Custom Search