Information Technology Reference
In-Depth Information
1
1
0.8
0.8
0.6
0.6
0.4
0.4
MV-CAD
AUC=0.850
MV-CAD
AUC=0.873
SV-CAD
AUC=0.858
0.2
0.2
SV-CAD
AUC=0.807
0
0
0
0.2
0.4
0.6
0.8
1
0
0.2
0.4
0.6
0.8
1
False positive rate
False positive rate
a) MLO view
b) CC view
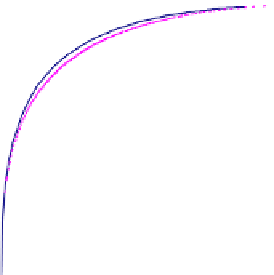
Fig. 7.
ROC analysis per a) MLO and b) CC view
p-values obtained are: 0.000 for MLO view and 0.035 for CC view, indicating a
significant improvement in the classification accuracy at a view level.
Furthermore, we observe that for both MV-CAD and SV-CAD the perfor-
mance for CC view in terms of AUC is better than that for the MLO view. This
can be explained by the fact that the classification of CC views is generally easier
than that of MLO views due to the breast positioning. At the same time our
multi-view system improves considerably upon the single-view CAD system in
better distinguishing cancerous from normal MLO views whereas for CC views
this improvement is less.
While the view results are very promising, from a radiologists' point of view it
is more important to look at the breast and case level performance. In
Tables 1 and 2 the AUCs from the multi-view and single-view systems are
presented as well as the corresponding p-values and 95% confidence intervals
obtained from the statistical tests for the differences between the AUC measures
for
MV-CAD-Causal
and the benchmark methods.
Table 1.
AUC and std.errors obtained from the single- and multi-view systems at a
breast
level with the one-sided
p
-values and 95% confidence intervals for the differences
BREAST
Method
AUC
±
std.err
p
-value Confidence interval
MV-CAD-Causal 0.876
±
0
.
011
-
-
MV-CAD-LR
0.869
±
0
.
011
2.9%
(0
.
000
,
0
.
009)
MV-CAD-NB
0.867
±
0
.
012
1.3%
(0
.
004
,
0
.
011)
SV-CAD
0.849
±
0
.
012
0.1%
(0
.
007
,
0
.
032)


Search WWH ::

Custom Search