Information Technology Reference
In-Depth Information
n
P
(
e
|
C
1
,...,C
n
)=
P
(
I
k
|
C
k
)
.
f
(
I
1
,...,I
n
)=
e
k
=1
Finally, it is assumed that
P
(
i
k
|
c
k
) = 0 (absent causes do not contribute to
the effect); otherwise,
P
(
I
k
C
k
)
>
0.
An important subclass of causal-independence models is obtained if the de-
terministic function
f
is defined in terms of separate binary functions
g
k
;itis
then called a
decomposable
causal-independence model [28]. Usually, all functions
g
k
(
I
k
,I
k
+1
) are identical for each
k
. Typical examples of decomposable causal-
independence models are the noisy-OR [30] models, where the function
f
repre-
sents a logical OR. A simple example for the application of the logical OR in the
domain of breast cancer is given in the Appendix, motivating the use of noisy-OR
models in the general theoretical framework presented in the next section.
|
5 Bayesian Multi-View Detection
The inputs for the proposed multi-view detection scheme are the regions detected
by a single-view CAD system presented in [17] and for completeness it is briefly
described here.
5.1 Single-View CAD System
As its name implies, the single-view CAD system analyses independently each
mammographic view of each breast. Figure 4 depicts a schematic representation
of the single-view system used in this study. It consists of the following four main
steps:
1.
Mammogram segmentation
into background area, breast, and for MLO, the
pectoral muscles.
2.
Local maxima detection
based on pixel-based locations. For each location
in the breast area a number of features are computed that are related to
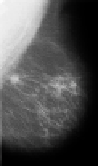
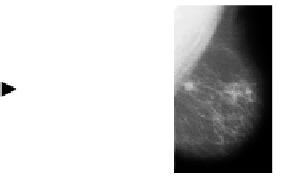
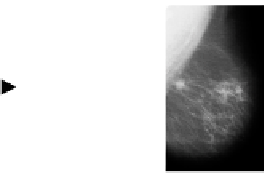
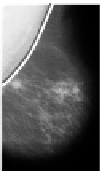
Original
mammogram
Mammogram
segmentation
Local maxima
detection
Region
segmentation
Region
classification
0.91
0.62
Fig. 4.
Stages in the single-view CAD system


Search WWH ::

Custom Search