Information Technology Reference
In-Depth Information
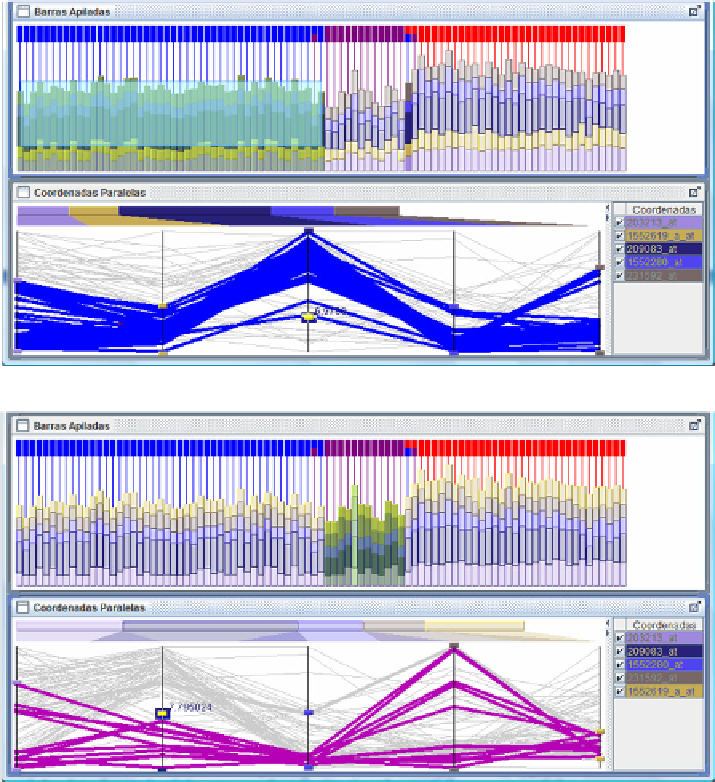
(a)
(b)
Fig. 6.
Representation of the probes for the individuals of the classes C1y C2.
Figure 6 represents the classification of individuals for the first class. As can be
seen in Figure 6a, when the individuals of the class C1 were selected, only one of the
individuals of the rest of the classes was activated. Figure 6b shows the results ob-
tained when the margin of parallel coordinates was configured in order to avoid the
activation of individuals of the other classes. As can be seen, only one individual of
the class C2 was deactivated, which indicated that it was out of the margins, with a
high value for the probe 15552280_at.
To obtain a visual representation of the patient's classification, we use the MDS
[18] [19] [20], and the dimensionality of the data is reduced to three. Figures 7a and
8b represent the information once MDS has been applied and, as shown, the individu-
als of the different clusters are separated in the space. Figure 7 shows a representation
Search WWH ::

Custom Search