Information Technology Reference
In-Depth Information
(209083_at <= 0.25) and (1552280_at <= 0) => Class =C2 (10.0/1.0)
(231592_at >= 1) => Class=C2 (4.0/1.0)
(203213_at >= 0.75) => Class =C3 (29.0/0.0)
(1552619_a_at >= 0.5) => Class =C3 (2.0/0.0)
=> Class =C1 (46.0/1.0)
Fig. 3.
Decision Rules obtained in the revision phase.
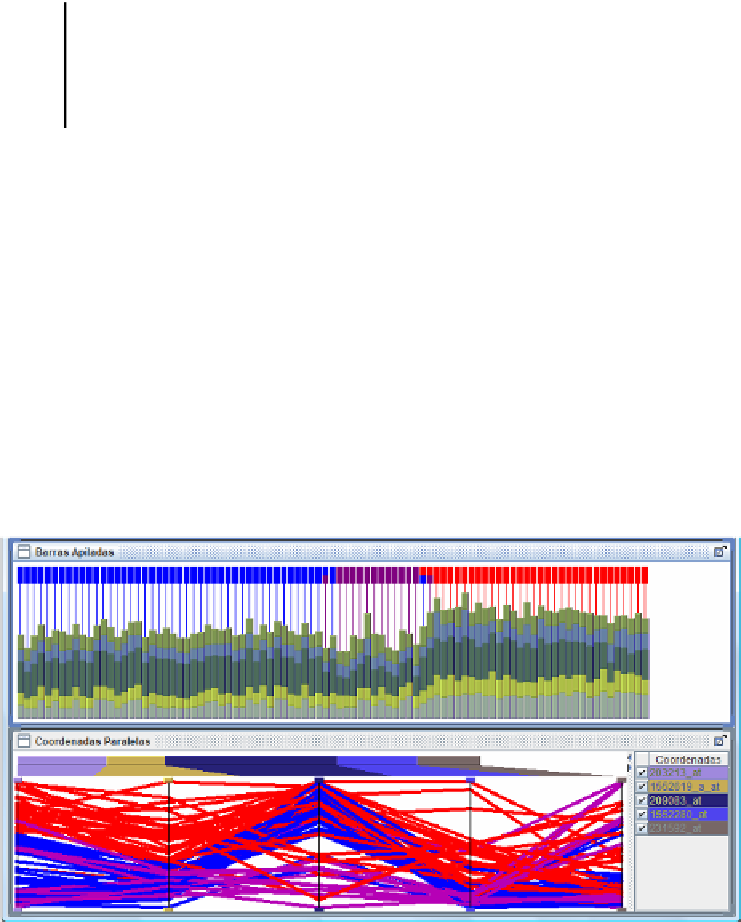
Figure 4 represents some graphics where the values of the retrieved probes are
compared, and the information obtained from the retrieved probes is presented as
decision rules. The values of the probes shown in Figure 4 are not the discretized ones
used for the decision rules. At the top of Figure 4, both the real classification and the
classification predicted by the system are presented by means of decision rules. If the
colour matches, then there is a coincidence in the classification. As can be seen, there
is an individual misclassified in the first of the classes identified in Figure 4, zero in
the second class and two in the third class. At the bottom of Figure 4, it is possible to
observe the parallel coordinates and the colours represent the class associated to the
individual. As can be seen, it is possible to distinguish the probes associated to each
of the classes. In this way, in the first of the coordinates can be seen how a group of
individuals is separated from the rest.
Fig. 4.
Representation of the retrieved probes in terms of decision rules for the 91 individuals.
Figure 5 shows the classification of the individuals for the last class. Figure 5a
shows the individuals classified to the class C3. In the classification of the individu-
als, the parallel coordinates establish the top and bottom margins for each of the
probes, facilitating a graphical representation of the information contained by the
rules. Once the margins are established, the individuals out of the ranks are shown as
dimmed in the bars and the parallel coordinates. As can be seen in Figure 5a, when
the individuals marked in red colour were selected, some individuals marked in blue

Search WWH ::

Custom Search