Information Technology Reference
In-Depth Information
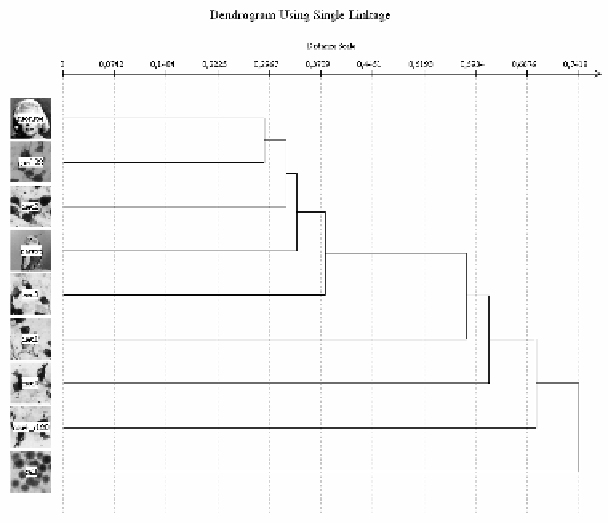
Fig. 31.
Dendrogram for image description of marginal distribution of the diagonal use of the
similarity measure of the Euclidean Distance
of the cophenetic-similarity value all images are in different clusters, including im-
ages with the same best segmentation parameters like neu4 and parrot.
By taking into account the row histograms in Fig. 29, the cut-off should be done by
the cophenetic-similarity value equal to 0.25, which is able to separate the images
neu4 and neu4_r180. However, with this choice again all the images would be as-
signed to different clusters.
By comparing column and row histograms together in Fig. 30, we should cut the
dendrogram by the cophenetic-similarity value equal to 0.39, in order to separate the
rotated images. Then only neu4_r180 and neu3 would be clustered together, but these
two images have different best segmentation parameters and hence, should not be
assigned to the same case. Thus, the final cut-off should be done by the cophenetic-
similarity value equal to 0.34. However, this choice would again, lead to having all
images in different clusters.
By considering the diagonal histograms in Fig. 31, we should cut the dendrogram
by the cophenetic-similarity equal to 0.66 to separate the images neu4 and neu4_r180.
With this choice we would get neu4 and parrot, which have the same best segmenta-
tion parameters in the same cluster, as desired. However, also monroe, gan128, neu2,
neu3 and neu1 would be assigned to that cluster. Since monroe would result as un-
der-segmented as concerns the hair by the best segmentation parameters of gan128
(compare Fig. 32), we have to cut the dendrogram by the cophenetic-similarity equal
to 0.275. Then again all images would be in different clusters.
Search WWH ::

Custom Search