Information Technology Reference
In-Depth Information
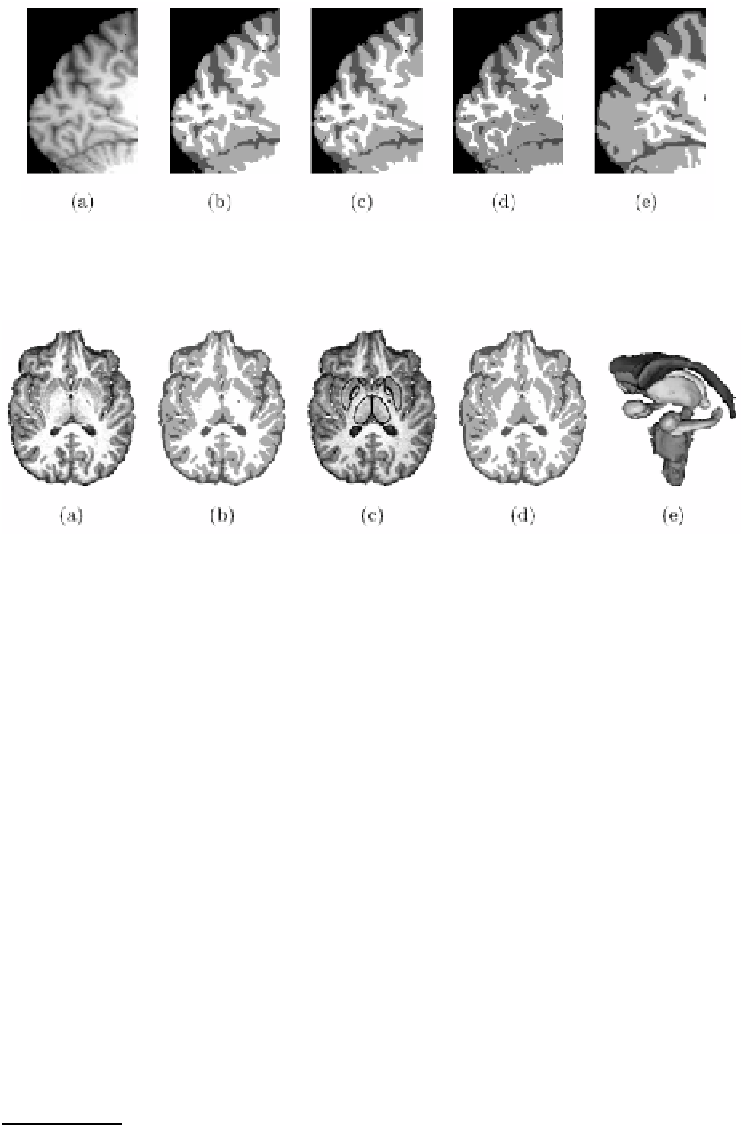
Fig. 4.
FBM-T. Segmentations respectively by FBM-T (b), LOCUS-T (c), SPM5 (d)
and FAST (e) of a highly nonuniform real 3T image (a)
Fig. 5.
Evaluation of FBM-TS on a real 3T brain scan (a). For comparison the tissue
segmentation obtained with FBM-T is shown in (b). Images (c) and (d): structure
segmentation by FBM-TS and corresponding improved tissue segmentation. Image
(e): 3-D reconstruction of the 17 segmented structures: the two lateral ventricules,
caudates, accumbens, putamens, thalamus, pallidums, hippocampus, amygdalas and
the brain stem. The computational time was
<
15
min
after the registration step
very satisfying robustness to noise and intensity nonuniformity. On BrainWeb
images, it is better than SPM5 and comparable to LOCUS-T and FAST, for a
low computational time. The mean Dice metric over all eight experiments and
for all tissues is 86% for SPM5, 88% for FAST and 89% for LOCUS-T and
FBM-T. The mean computation times for the full 3-D segmentation were 4min
for LOCUS-T and FBM-T, 8min for FAST and more than 10min for SPM5. On
real 3T scans, LOCUS-T and SPM5 also give in general satisfying results.
6.2 Joint Tissue and Structure Segmentation
We then evaluated the performance of the joint tissue and structure segmentation
(FBM-TS). We introduced
apriori
knowledge based on the Harvard-Oxford
subcortical probabilistic atlas
1
. Figures 5 and 6 show an evaluation on real 3T
brain scans, using FLIRT [25]
2
to ane-register the atlas. In Figures 5 and 6,
1
http://www.fmrib.ox.ac.uk/fsl/
2
http://www.fmrib.ox.ac.uk/fsl/flirt/


Search WWH ::

Custom Search