Image Processing Reference
In-Depth Information
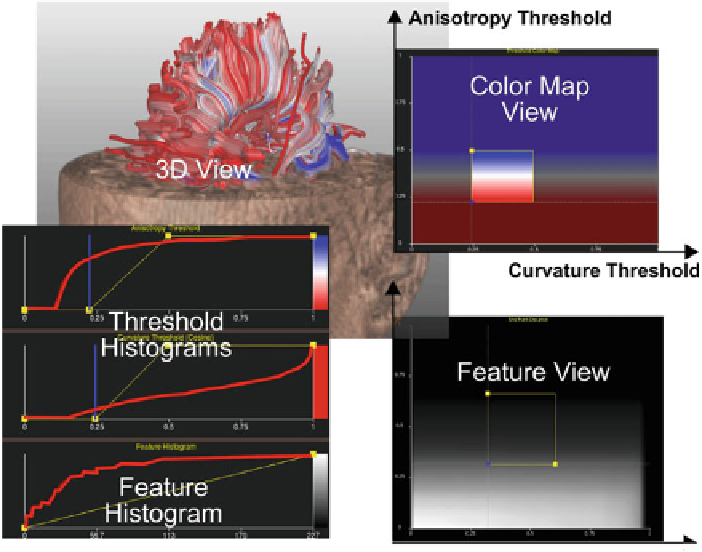
Fig. 8.4
Main viewports of Brecheisen et al. [
7
] exploration tool.
Top-left
3D visualization of fiber
tract together with anatomical context and axial fractional anisotropy slice.
Top-right
Color map
view used for selecting individual threshold combinations and definition of color detail regions.
Bottom-right
Feature map view showing changes in quantitative tract features as a function of
threshold combination at discrete sample points of the parameter space.
Bottom-left
Cumulative
histograms of both threshold and feature values. © IEEE Reprinted, with permission, from IEEE
Transactions on Visualization and Computer Graphics 15(6)
Jiao et al. [
29
] introduce a toolkit based on three streamline distances that are used
tomeasure differences between fiber bundles. The user can vary parameters that affect
the results of the fiber tractography and measure the resulting differences based on
these distances. This allows them to quantify the variation and reproducibility of the
fiber bundles due to different sources of uncertainty and variation in the tractography
input parameters.
Although these methods provide a first step to study uncertainty due to parameter
settings, it remains a time consuming exploratory task for the user. This is especially
true if parameters are correlated, and their interrelation needs to be investigated.
Search WWH ::

Custom Search