Image Processing Reference
In-Depth Information
designed to assist analysts in quantifying and utilizing uncertainty in the human
analysis process.
Network defense often requires the analysis of uncertain and deceptive data [
2
,
3
].
Information overload is also a problem for network analysts. Recent work has found
that information overload can be mitigated bymechanisms that preserve intermediate
analysis results [
5
]. Network analysts have also shown preference to tools that help
them build reports that reflect analysis processes and results [
8
]. Similarly, our work
attempts to provide analysts a consistent and convenient method of storing interme-
diate analysis results regarding attack uncertainty. At any point in the analysis, these
results can be exported for future analysis.
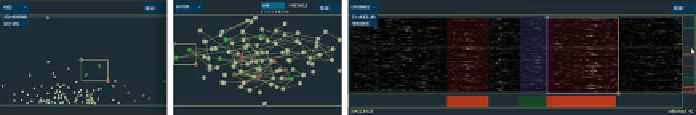
7.3 SybilVis System Overview
The SybilVis system consists of three linked views designed to allow analysts explore
time-varying network connectivity data in varying levels of detail (see Fig.
7.1
). The
time histogram displays node activity over time. The X axis represents timesteps;
The Y axis represents node ID. The node link view displays the network for a given
time range. In the node link view, individual timesteps are added together to make
an aggregate of network activity over time. To avoid network clutter, links are only
shown between nodes if they exceed a user-defined threshold. This threshold can
be changed interactively. The scatterplot view displays either the first and second
eigenvectors or the non-randomness and connection-degree of the nodes.
A typical analysis session begins with the time histogram view, which shows an
overview of node activity over all available timesteps. Time ranges can be explored in
sequence, or the analyst may make a selection on the time histogram that corresponds
to periods of increased or erratic activity. Once a time range is chosen, the node
link and scatterplot views are updated accordingly. Analysts generally investigate
clusters and outliers in the scatterplot view. Similarly, for the node link view, tightly
linked clusters of nodes can indicate suspicious activity. Many rounds of analysis are
typically required to determine attack scope. Previously, external sources (i.e. pen and
paper, human memory) were required to track intermediate analysis results, which
were often inconclusive until further time ranges were investigated. To address this,
we developed uncertainty and annotation views and interactions, which are described
in the following section.
Fig. 7.1
An overview of the SybilVis system

Search WWH ::

Custom Search