Image Processing Reference
In-Depth Information
h
(
x
1
)
h
(
x
2
)
h
(
x
3
)
h
(
x
4
)
←
x
→
Fig. 3.5
Once the hixels have been bucketed and modes have been identified, we compute the pmis
between buckets that are spatially adjacent and connect those with positive associations to form
sheets. ©IEEE reprinted, with permission, from Thompson et al. [
10
]
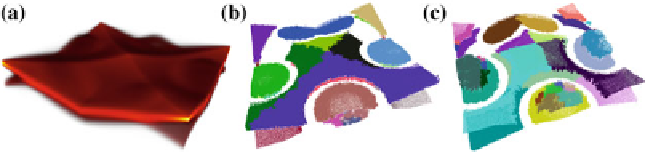
Fig. 3.6 a
Volume rendering of a hixel data set generated by sampling a mixture of Poisson and
normal distributions. Basins of minima (
b
) and of maxima (
c
) are shown for sheets, identifying
prominent features associated with each process in the mixture model. ©IEEE reprinted, with
permission, from Thompson et al. [
10
]
512 hixels in the mixture model data set, each with 128 equally-
sized bins. The shortest axis in the images corresponds to histogram bins, thus a
spatially higher location along that axis indicates a higher function value. The data
is a mixture of two distributions at each hixel with 3,200 samples from a Poisson
distribution and 9,600 samples from a Gaussian distribution. Hue and opacity are
used to illustrate the density of samples. When the number of samples in a hixel bin
is zero, the bin is rendered as a transparent red. When the number of samples in a
bin is large, the bin is rendered as an opaque yellow.
Each hixel's Poisson and Gaussian distribution have different parameter values
that vary smoothly over the image. The Poisson
There are 512
×
parameter is a maximum of 100
at five source points arranged in a circle and decreases to a minimum value of
approximately 12 proportional to the distance to the nearest of these points. The
Gaussian mean (standard deviation) is a minimum (maximum) at 4 points arranged
in the same circle as the 5 Poisson source points. The mean varies from 32 to 108
while the standard deviation varies from 16 to 3.8. Topological basins of minima
and maxima are shown in Fig.
3.6
b, c for all sheets with pmi greater than zero. Our
approach clearly extracts separate sheets belonging to the two processes, allowing
topological analysis to identify the prominent features of each distribution.
λ


Search WWH ::

Custom Search