Image Processing Reference
In-Depth Information
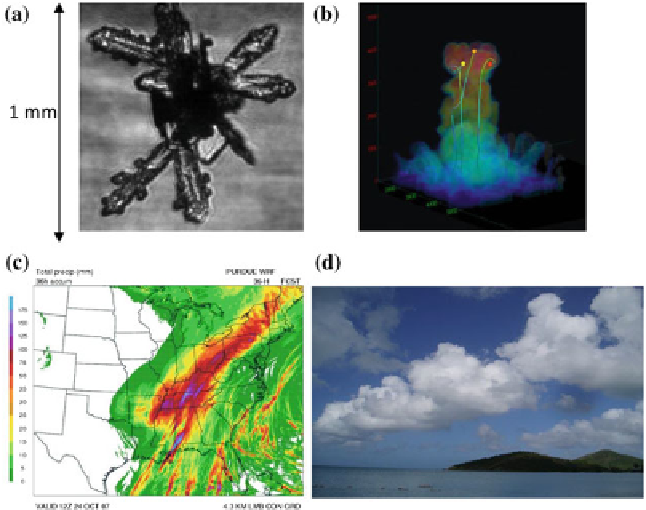
Fig. 28.1
Multi-scale examples,
a
microscale,
b
cloud scale,
c
storm scale, and
d
global scale. ©
IEEE reprinted, with permission, from IEEE transactions on visualization and computer graphics
12(5)
scalar and vector fields that vary over time. Current tools for atmospheric visualiza-
tion and analysis are incapable of the following crucial functions:
Integrating these various data sources and providing effective interfaces for fusion,
analysis, experimentation, exploration, hypothesis testing, and discovery.
Communicating the complex three-dimensional, time-varying information neces-
sary to accurately predict atmospheric events, conditions, and consequences (e.g.,
aircraft icing) and extend the understanding of atmospheric phenomena.
Integration of visual representations into the scientific analysis and discovery
process.
28.1.2 Transformational Cross-Scale Science
Facilitating breakthrough scientific discoveries will require the development of trans-
formational science that produces revolutionary new tools for mastering the multi-
and cross-scale challenges of our world. Science discovery possibilities are presented
here as a broad spectrum of disciplines, including the following.
1
1
This is summarized from the NSF Science and Engineering CommunityWorkshop report by Ebert
D., Gaither K., and Gilpin C.
Search WWH ::

Custom Search