Image Processing Reference
In-Depth Information
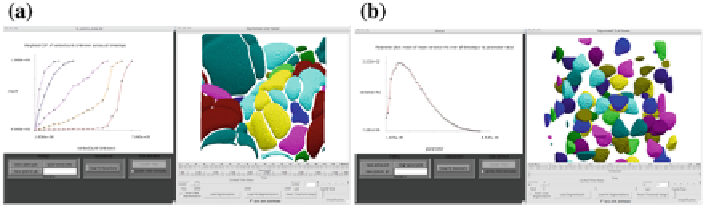
Fig. 27.9 a
Weighted cumulative density function of feature volume in an idealized premixed
hydrogen flame echoing Fig. 9d in [
2
].
b
The average density variance for features defined by
different density thresholds in a simulation of hydrogen under pressure
27.6 Results
Using the combined visual exploration and analysis capabilities, scientists are able
to quickly produce feature-based statistical summaries of their data. For example,
Fig.
27.8
shows the distribution of scalar dissipation rate in a temporally-evolving
turbulent CO/H
2
jet flame undergoing extinction and reignition at different Reynolds
numbers [
10
]. The features of interest are defined by locally varying isovalues of the
scalar dissipation rate, and a merge tree is used to encode the feature hierarchy. Of
interest to the scientists is the relationship between the temperature and thickness of
these structures, and so themerge tree was augmentedwithmean and variance of tem-
perature in addition to lengthscale measurements. Figure
27.9
a shows the weighted
cumulative volume distribution of an idealized pre-mixed combustion simulation [
5
]
along side the corresponding segmentation. Figure
27.9
b shows the average density
variance for different density thresholds in a simulation of hydrogen under pressure.
As the threshold is lowered the variance increases up to a breaking point, after which
it rapidly falls. The corresponding segmentation is generated using the approximate
threshold of the peak variance. Somewhat surprisingly, the peak variance does not
correspond to the point at which the individual surfaces begin to merge, rather there
are still a large number of well separated features.
27.7 Conclusion
This chapter summarizes a novel framework that combines topological and statisti-
cal analysis with visualization to perform feature-based statistical analysis of large
scientific data. The framework represents a novel technology that has converted the
typically cumbersome post-processing cycle of explore and analyze into an interac-
tive process, providing application scientists easy access to cutting edge visualization
and feature-based analysis techniques coupled to traditional statistical techniques. In
particular, this framework provides an intuitive GUI that enables traditional statisti-
Search WWH ::

Custom Search