Image Processing Reference
In-Depth Information
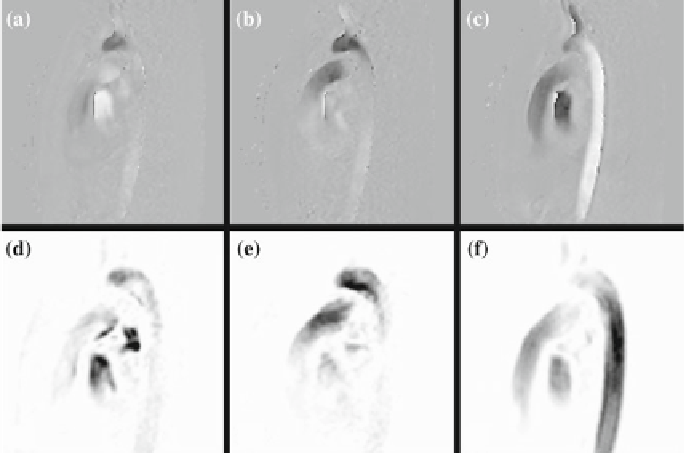
Fig. 25.2
The PC flow data set consists of 20 phases in time. Each phase in the series comprises a
velocity vector volume with a resolution of 144
×
×
.
×
.
×
.
7 mm.
a
PC-P
right to left;
b
PC-P anterior to posterior;
c
PC-P head to feet;
d
PC-M right to left;
e
PC-M anterior
to posterior;
f
PC-M head to feet © IEEE Reprinted, with permission, from IEEE transactions on
visualization and computer graphics 16(6)
144
50 voxels of 2
0
2
0
2
defined in centimeters per second. The range of the imposed speed limit, for example
(
radians.
If a suitable VENC is chosen, PC-MRI provides a data set with great correspondence
to the actual blood flowvelocity field [
15
]. As a consequence, the acquired data allows
for quantitative analysis of the blood flow behavior. PC cine MRI sequences support
the acquisition of volumetric blood flow data throughout the cardiac cycle, generat-
ing a 4D blood flow velocity field [
27
,
34
]. There are two customary approaches to
reconstruct the acquired raw data to the desired flow images [
3
]: phase (PC-P) and
magnitude (PC-M) reconstruction. Figure
25.2
depicts a single slice of the recon-
structed 4D flow data, at a certain point in time. The top row, Fig.
25.2
a-c, represents
the blood flow data in the three patient-oriented orthogonal directions, encoding both
speed and directions of the blood flow quantitatively. This data is commonly referred
to as the phase (PC-P) reconstruction. The bottom row, Fig.
25.2
d-f, represents the
blood flow data in three directions, encoding only speed. This data is commonly
referred to as the complex difference or magnitude (PC-M) reconstruction. Even
though the blood flow direction cannot be resolved from the PC-M reconstruction,
the resulting data is inherently less prone to the uncorrelated noise that is typical for
the PC-P reconstructed data.
−
100 cm/s, 100 cm/s], corresponds to the phase extremities, i.e.,
−
π
and
π
Search WWH ::

Custom Search