Image Processing Reference
In-Depth Information
for advanced visualization specific to ultrasound data. The chapter is divided into the
chosen taxonomy, in essence each step of the visualization pipeline; pre-processing,
entation, registration, rendering and augmented reality.
24.2 Taxonomy
Techniques for ultrasound visualization can be categorized in a variety of ways, e.g.,
when they where developed, which types of data modalities were utilized, which
anatomy the technique was focused on, etc. The development of new ultrasound
technology leads to different visualization techniques. The step from 2D ultrasound
images to 3D freehand ultrasound (2Dultrasoundwith position information) revealed
new challenges as spatial information could be included to generate volumetric data.
The recent development of 2D matrix probes provided again a new challenge of
3D
time (4D) data visualization. Karadayi et al. published a survey regarding 3D
ultrasound [
32
]. This chapter has a greater focus on data acquisition and volume
handling, but also gives a brief overview of visualization of 3D ultrasound data.
Another taxonomic scheme for ultrasound visualization is based on the different
types of data the technique utilized. 3D freehand and 4D ultrasound pose very dif-
ferent challenges compared to 2D ultrasound or when handling multiple modalities.
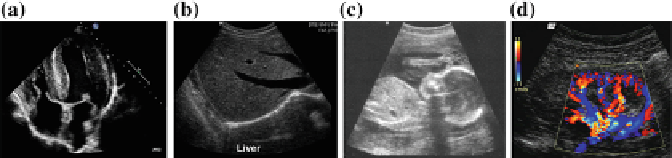
Blending B-mode ultrasound for tissue and Doppler ultrasound for blood flow can
be challenging enough in 2D and even more in 3D. An example image is shown
in Fig.
24.1
d. In addition to the ultrasound input, the combination of other medical
imaging modalities, such as CT or MRI with ultrasound, provide more information,
but also more challenges to the visualization researcher.
Different anatomic regions have different characteristics in ultrasound images, as
can be seen in Fig.
24.1
. For instance, in a liver scan one might look for tumors using
a high-resolution abdominal 2D probe. For heart infarctions, the doctor might need
to examine the strain in the heart muscle to detect defective muscle tissue. The large
difference between tissue and pathology leads to anatomically specific visualization
techniques.
In this survey we categorized around 60 papers and from the different categories
we generated a parallel-coordinate plot, shown in Fig.
24.2
. Looking at the graph, we
+
Fig. 24.1
Example ultrasound images from the cardiac (
a
), gastric (
b
), fetal (
c
) and Blood flow
(
d
) domain

Search WWH ::

Custom Search