Image Processing Reference
In-Depth Information
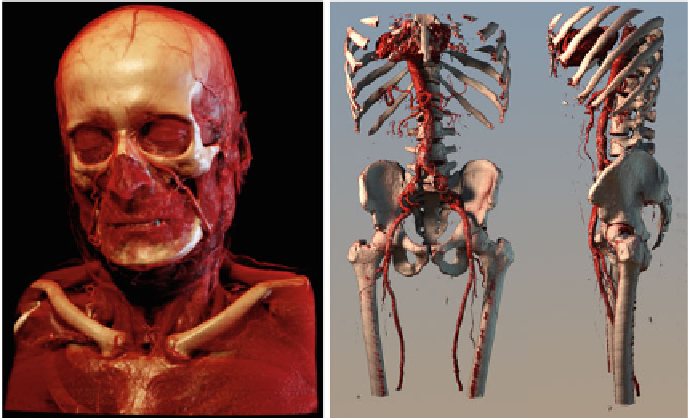
Fig. 23.4
Two examples of
interactive
visualizations made with the volume renderer of Kroes
et al. [
44
]. Through the use of GPUs, physically-based lighting has become possible in an interactive
volume rendering setting, enabling increased realism through soft shadows, depth of field and in
this case mixed phase function and BRDF surface scattering
23.3.9 Visual Analysis in Healthcare
Visual analysis is becoming an essential component of medical visualization due
to the rapidly growing role and availability of complex multi-dimensional, time-
varying, mixed-modality, simulation and multi-subject datasets. In our view, the
magnitude and especially the heterogeneity of the data necessitate the use of visual
analysis techniques.
Existing examples involving time-varying data include the work of Coto et al. [
16
]
on DCE-MRI mammography and Oeltze et al. [
54
] on perfusion data in general and
MR perfusion of the brain in particular. Blaas et al. applied visual analysis techniques
to multi-modal medical data, whilst Zachow et al. [
77
] focused on nasal airflow
simulation data combined with anatomical information.
There is great potential for visual analysis in medical visualization, with clini-
cal applications including advanced diagnosis and medical research and, even more
importantly, treatment planning and evaluation, e.g. radio therapy planning and post-
chemotherapy evaluation. The new Visual Analysis in Healthcare (VAHC) work-
shops that were held at IEEE VisWeek in 2010 and 2011 underline the emerging
importance of this research direction.
Search WWH ::

Custom Search